Engineering for a sustainable future

2,519
Patents and active patent applications

77%
No oil projects backlog

2050
Net zero for scope 1, 2 and 3

71€ MIO
Total expenditure on innovation
Header
Introducing Bluenzyme200™, the new solution by Saipem for carbon capture.
Text
The innovative plug&play solution devoloped by Saipem engineers to sustainably speed up the path towards net zero. Easy to install, efficient and sustainable
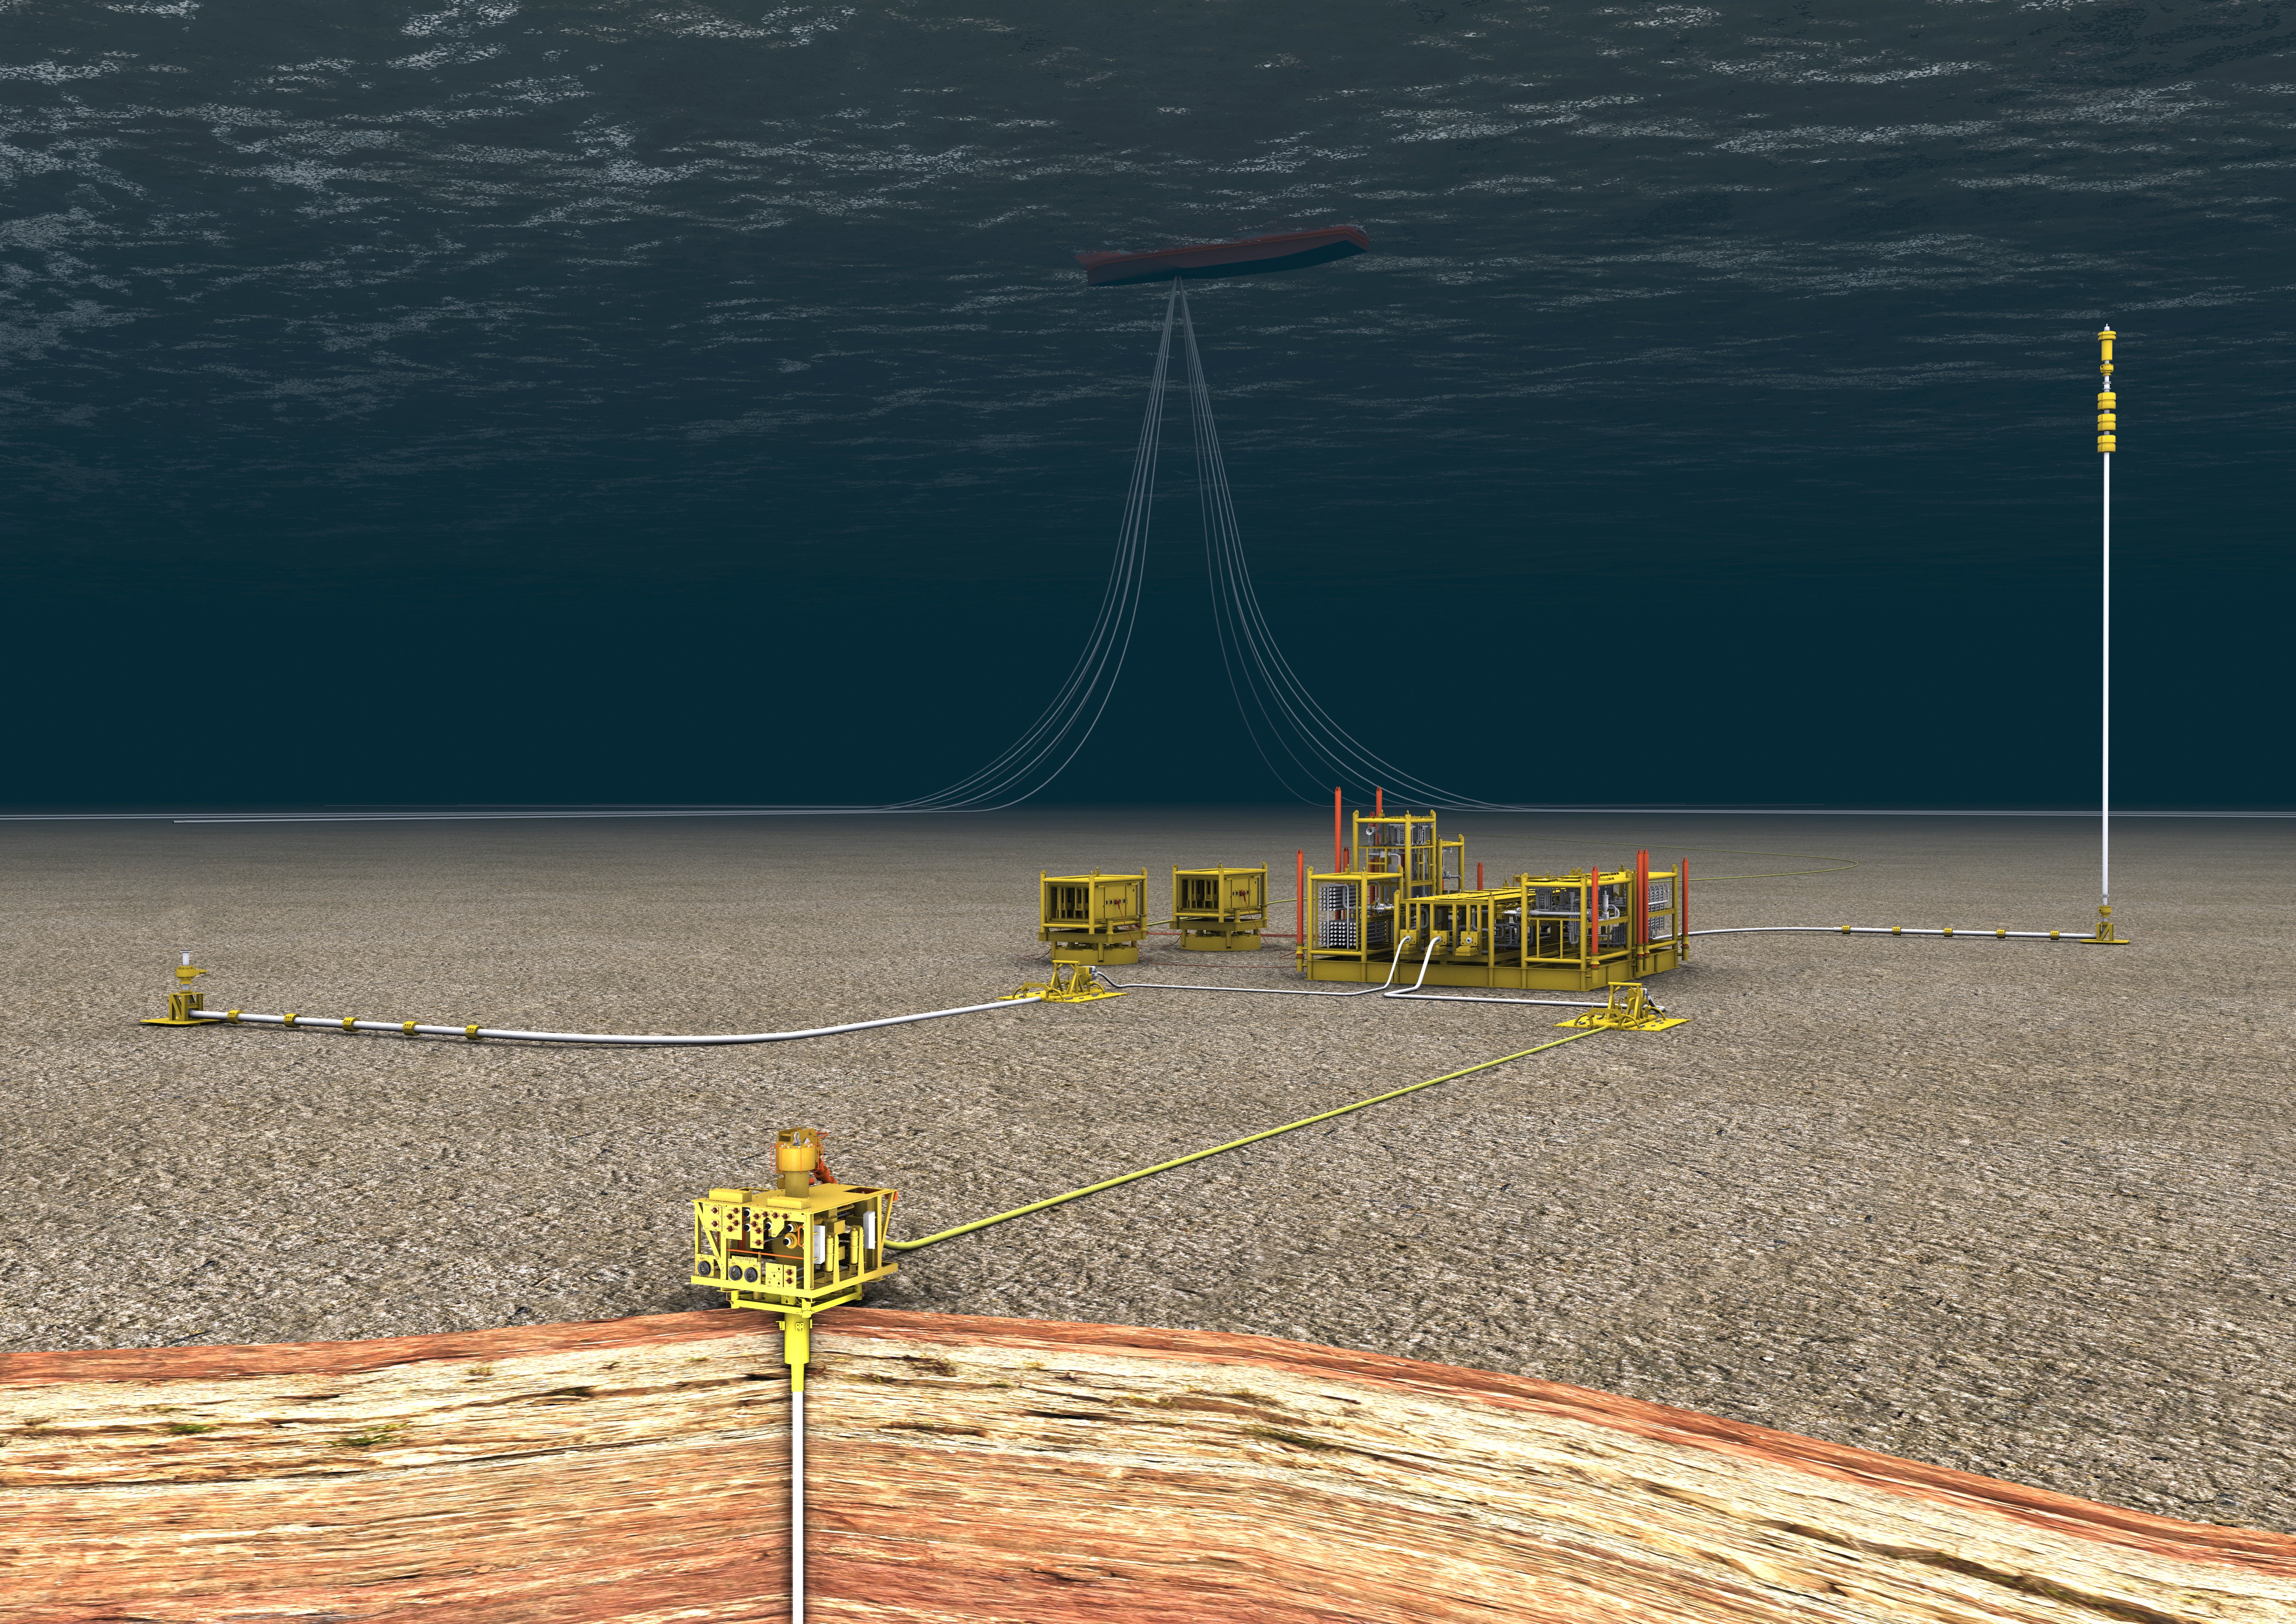
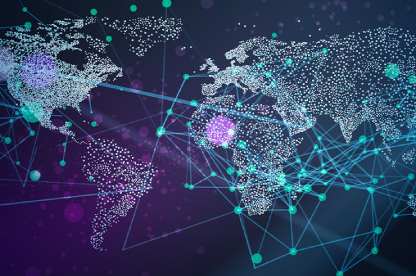
Our solutions
Image
Image
Image
Image
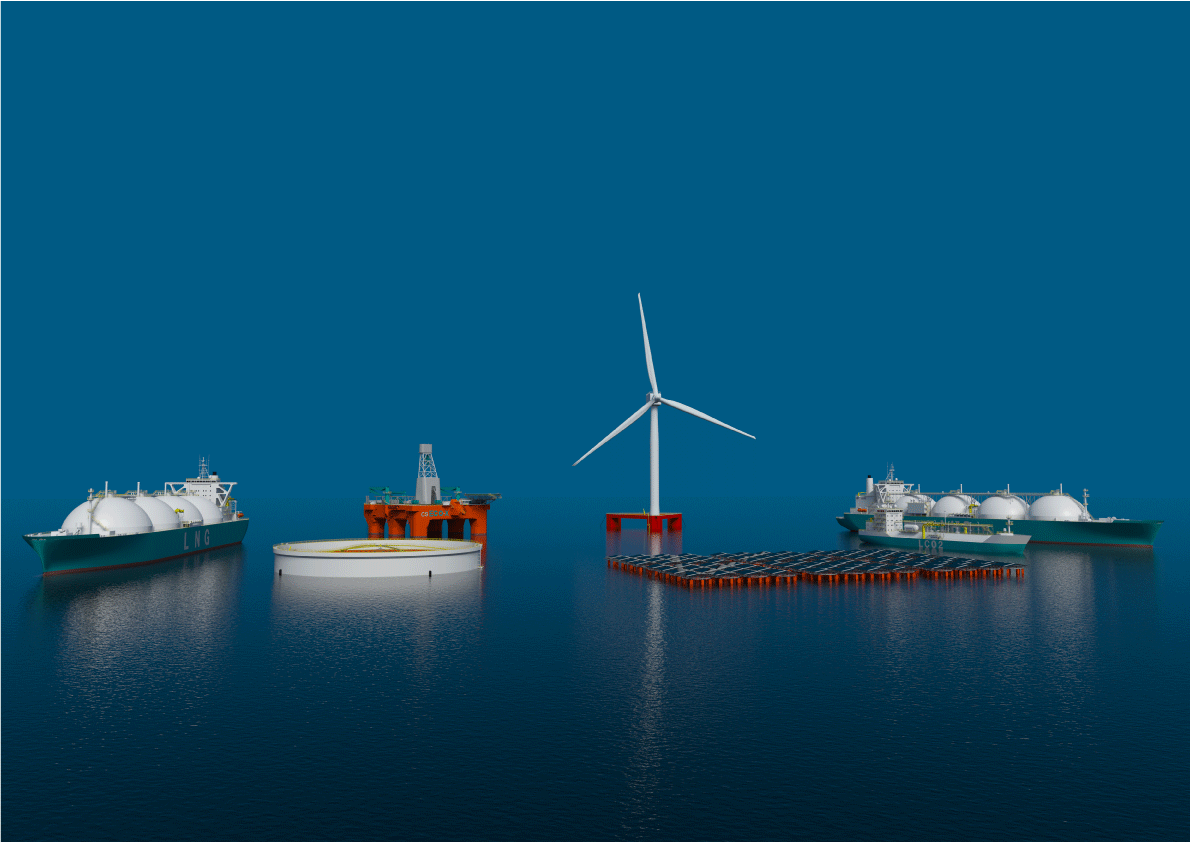
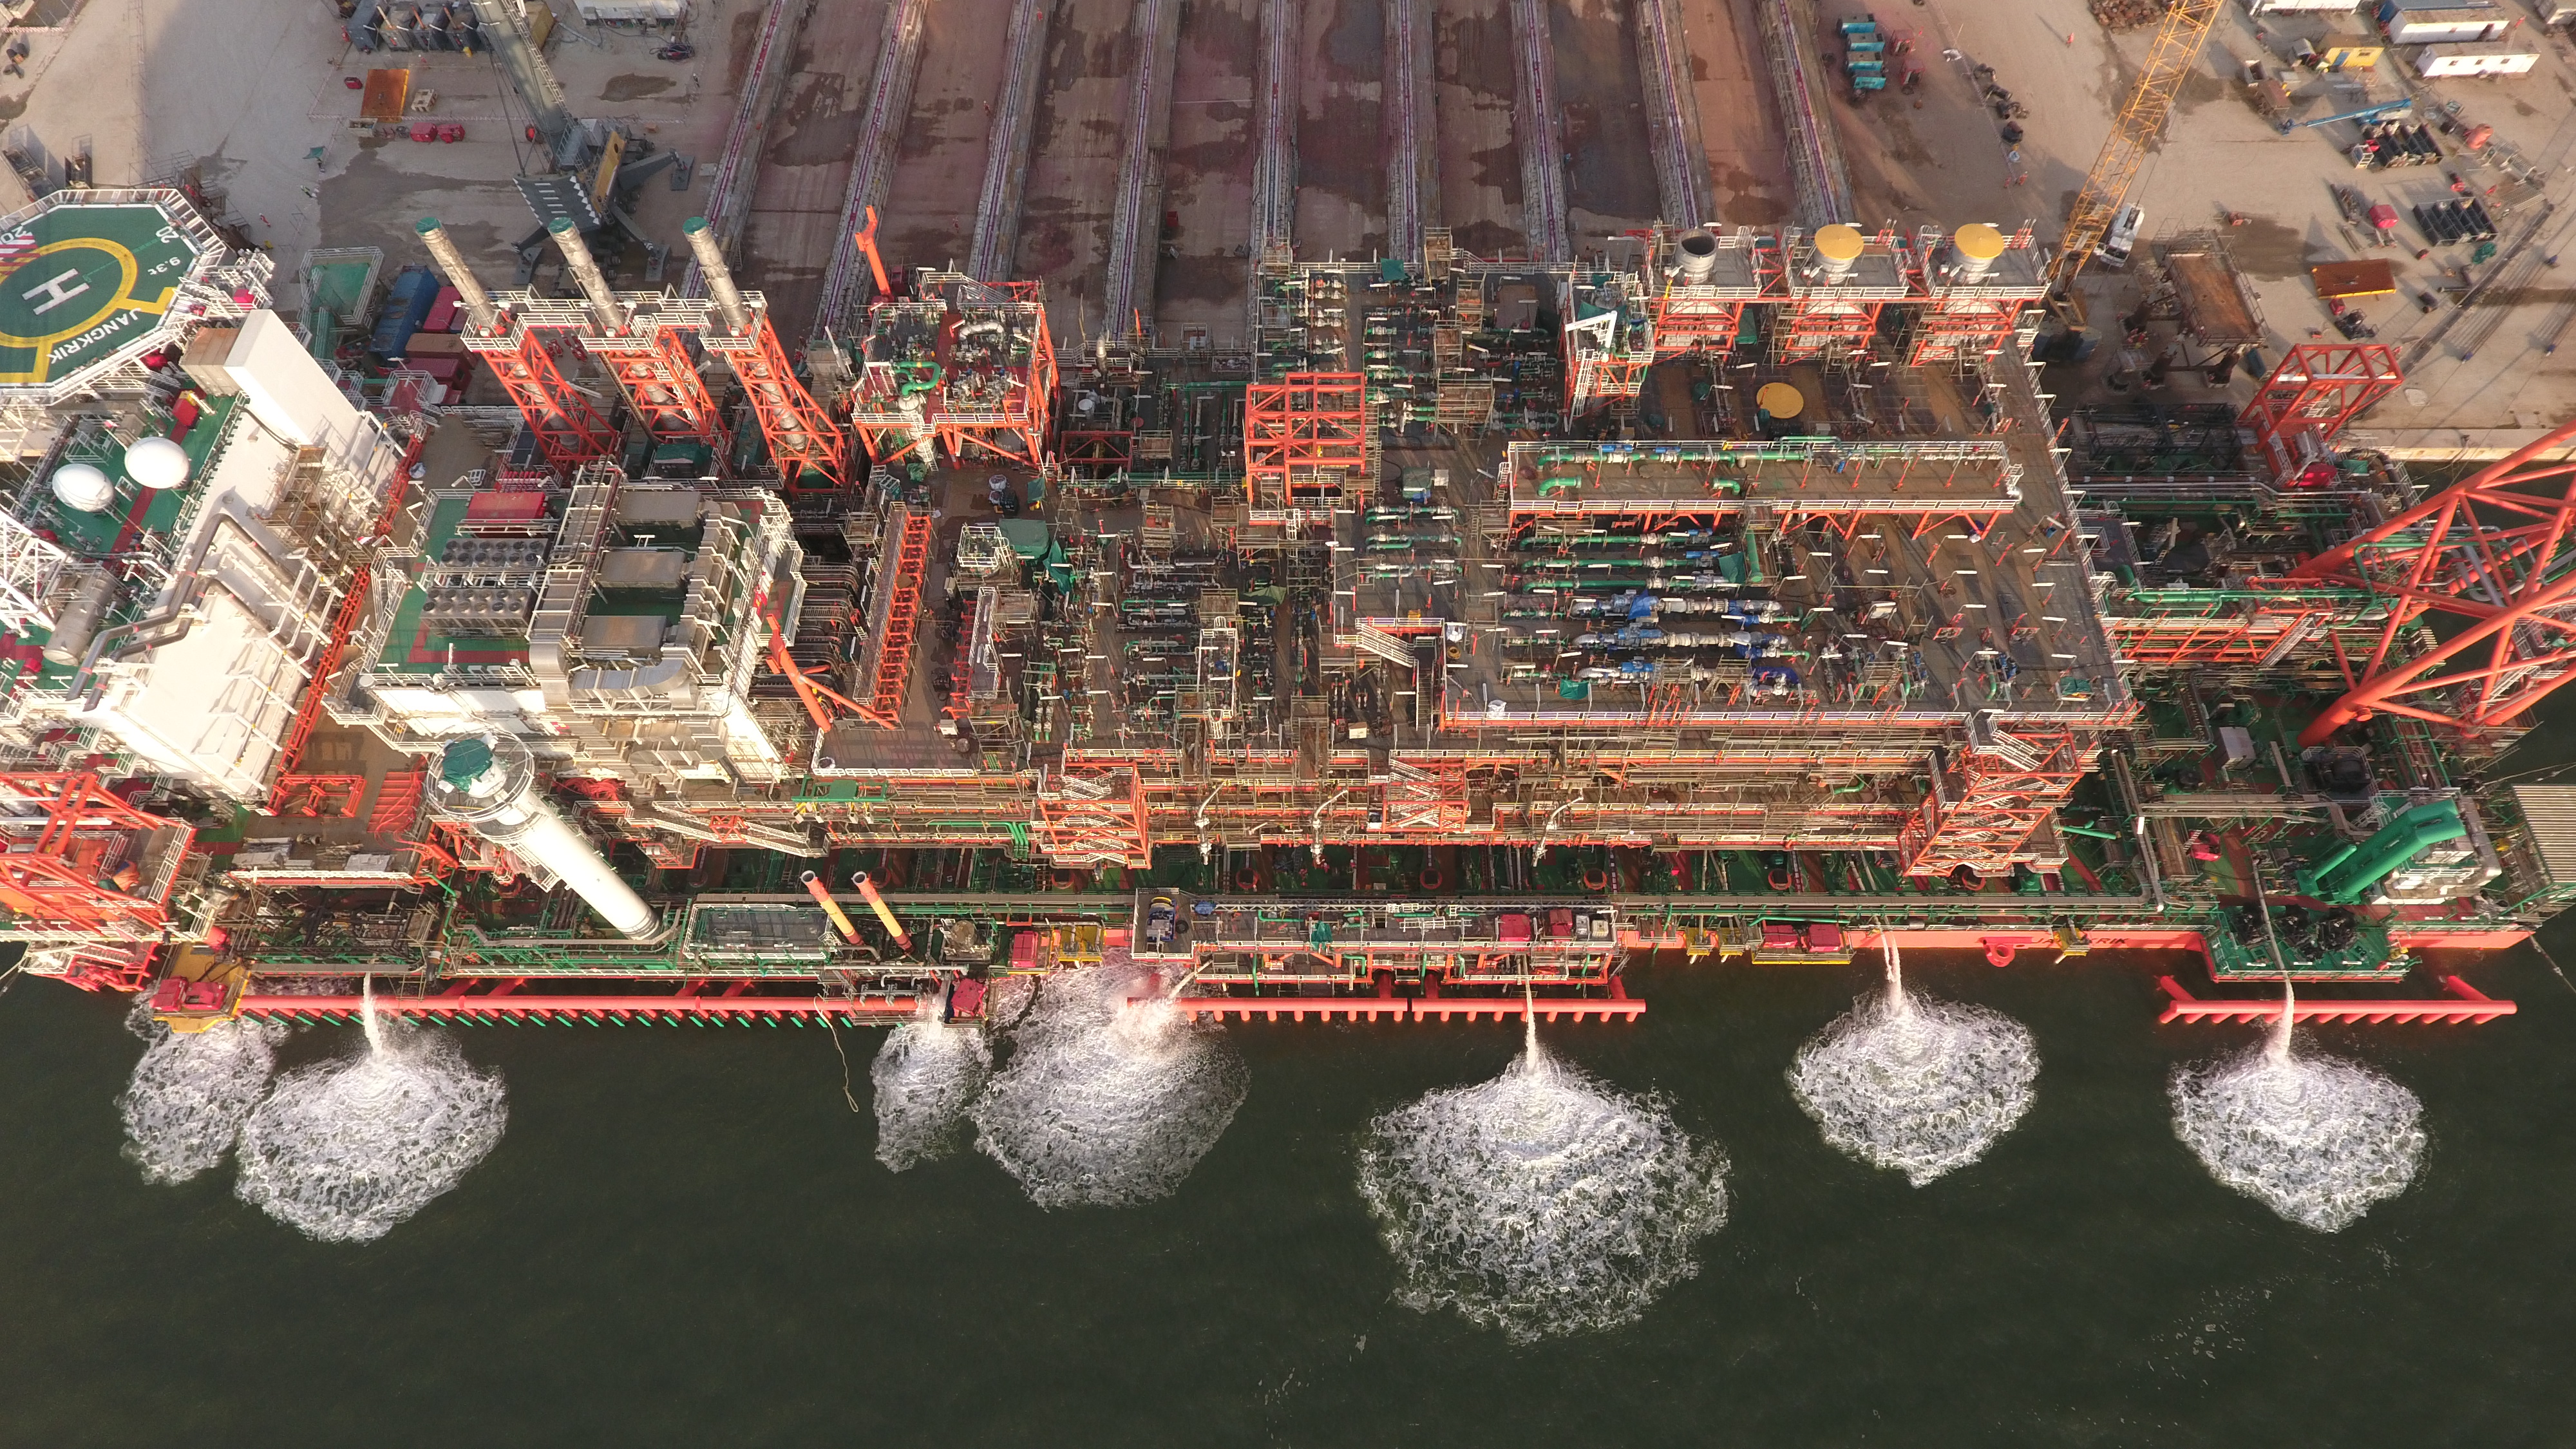
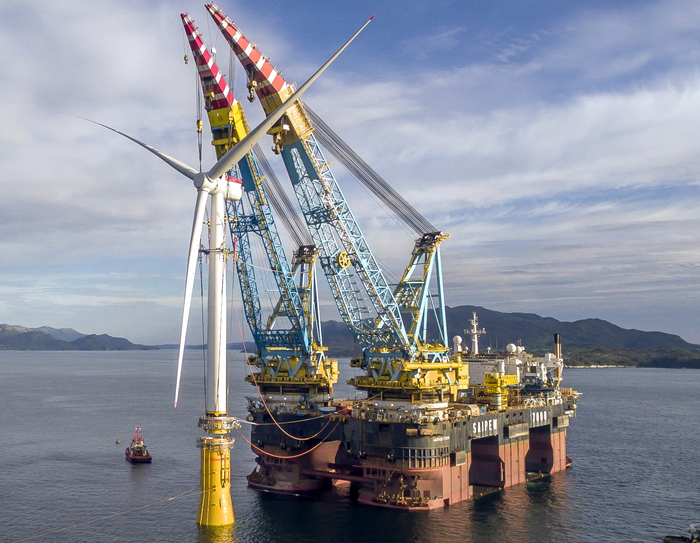
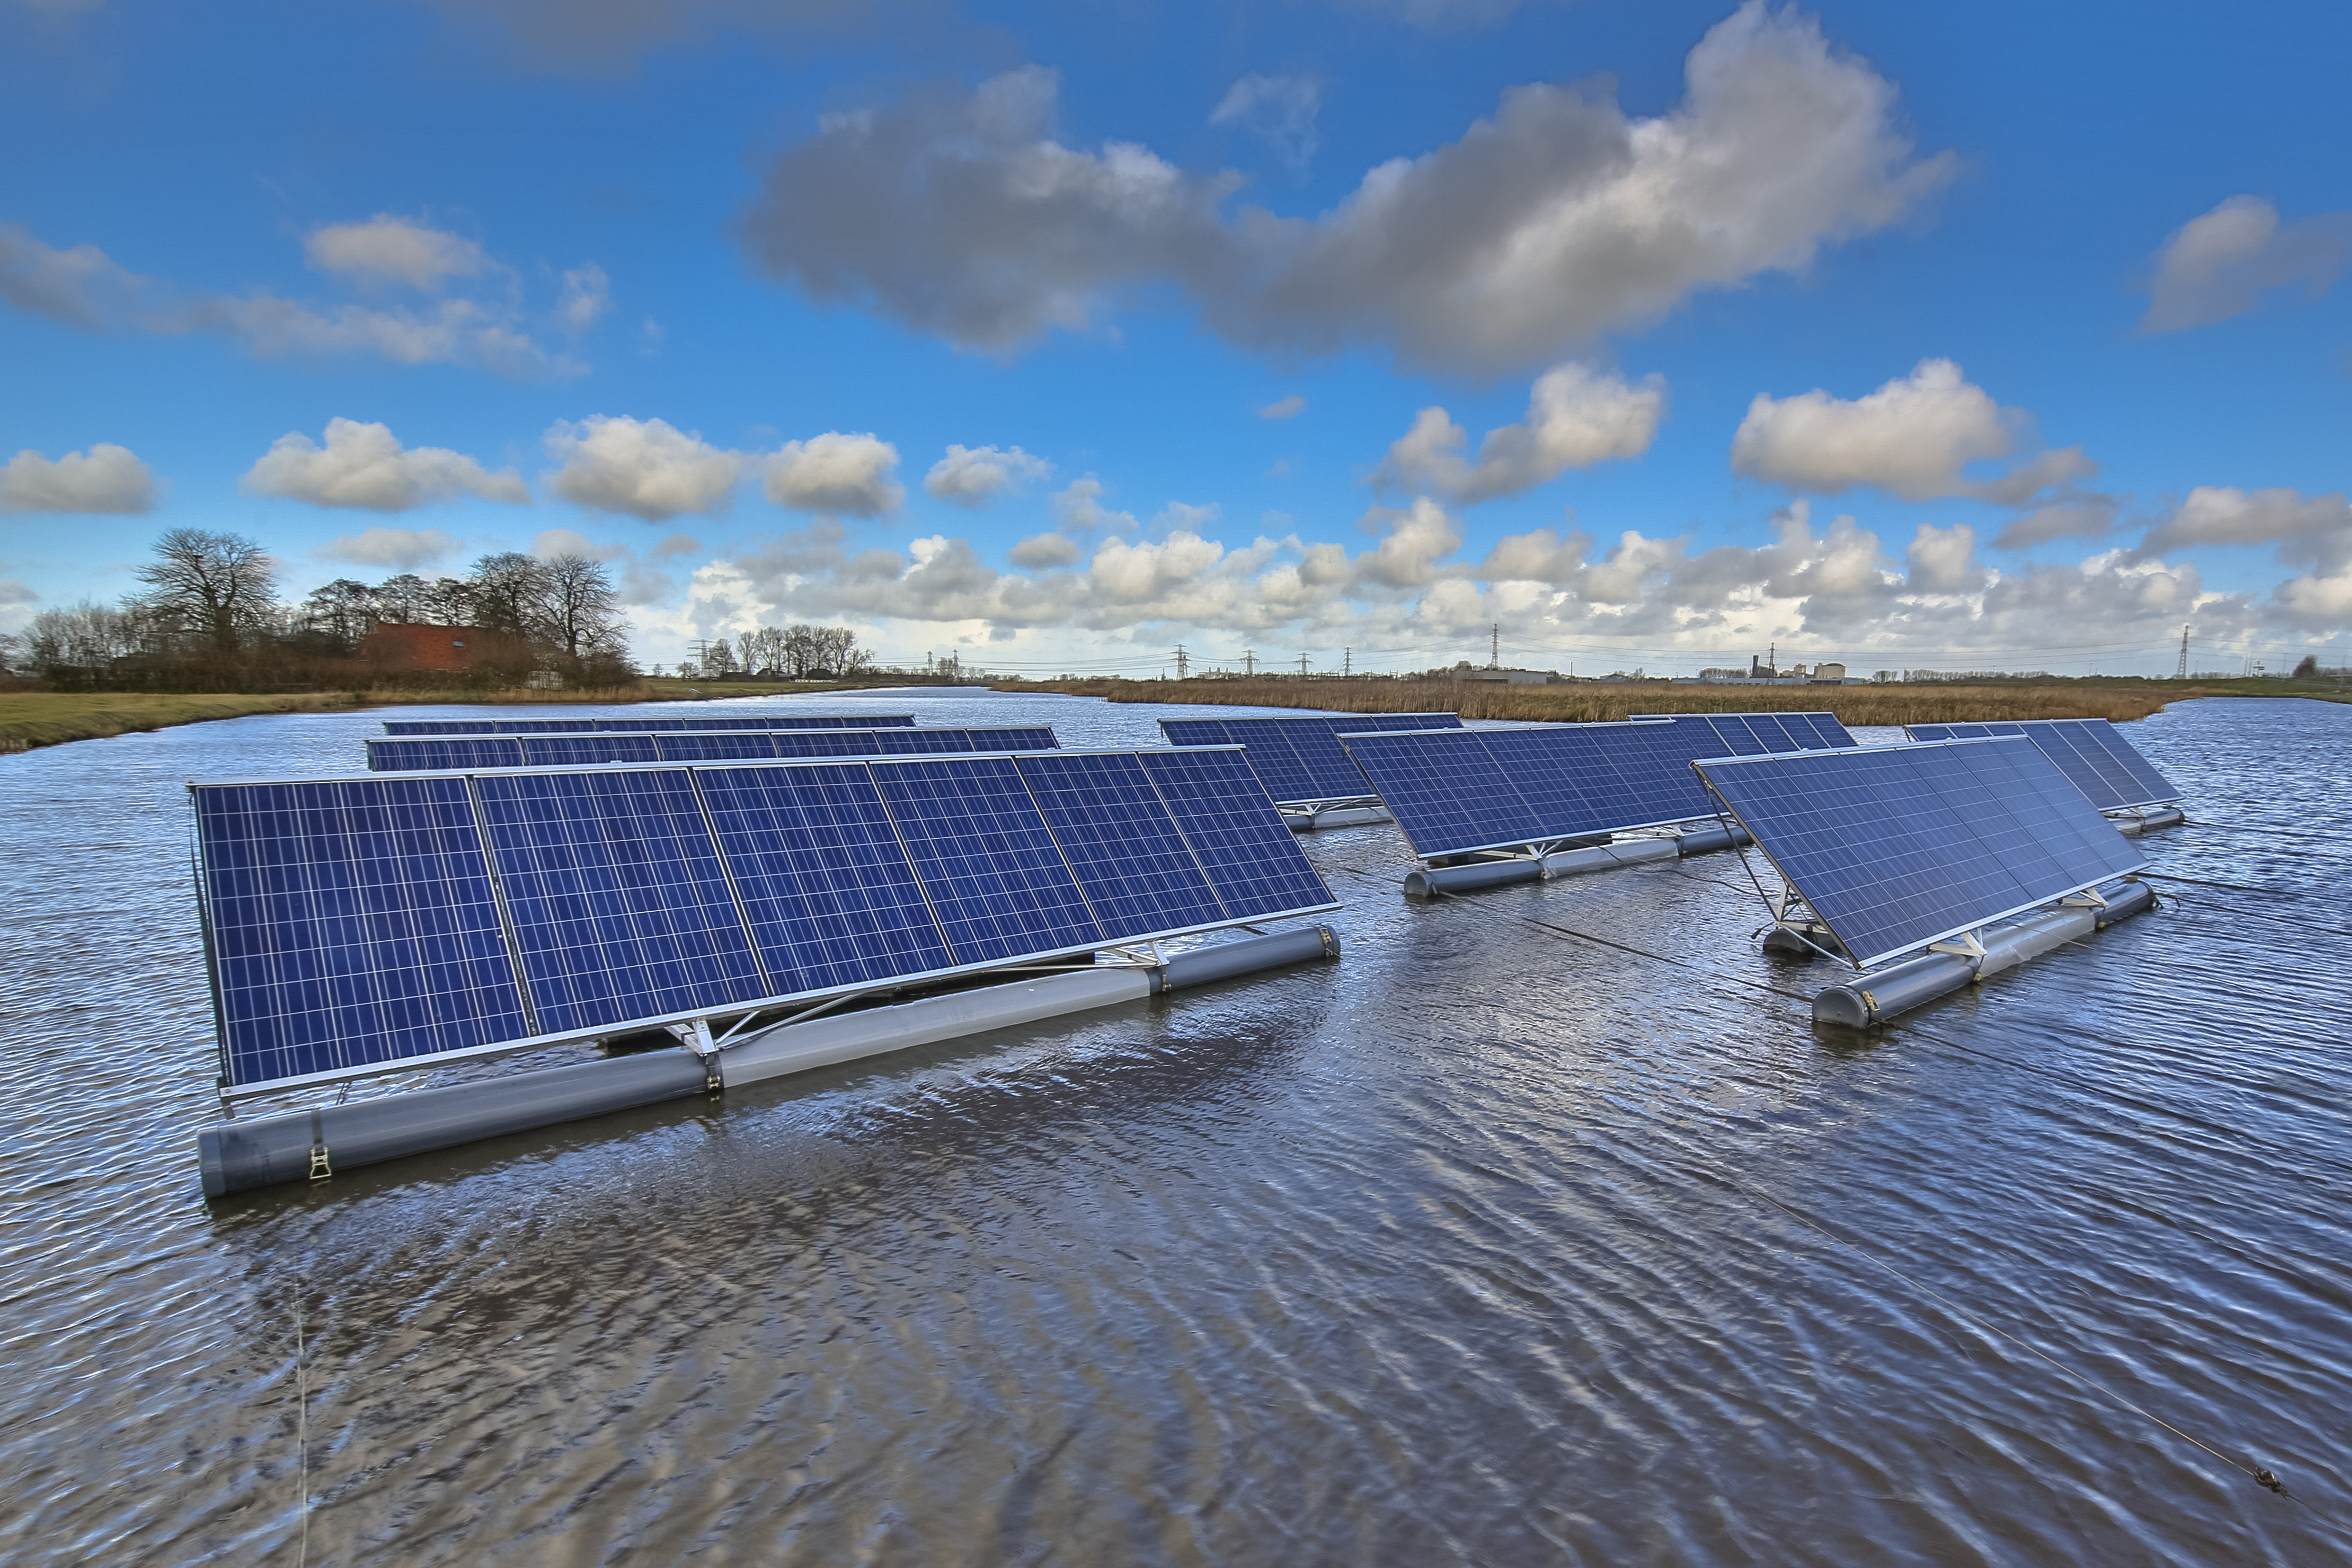
Floating High Tech
A vast mix of engineering specialists and project delivery services for various floating solutions.
Image
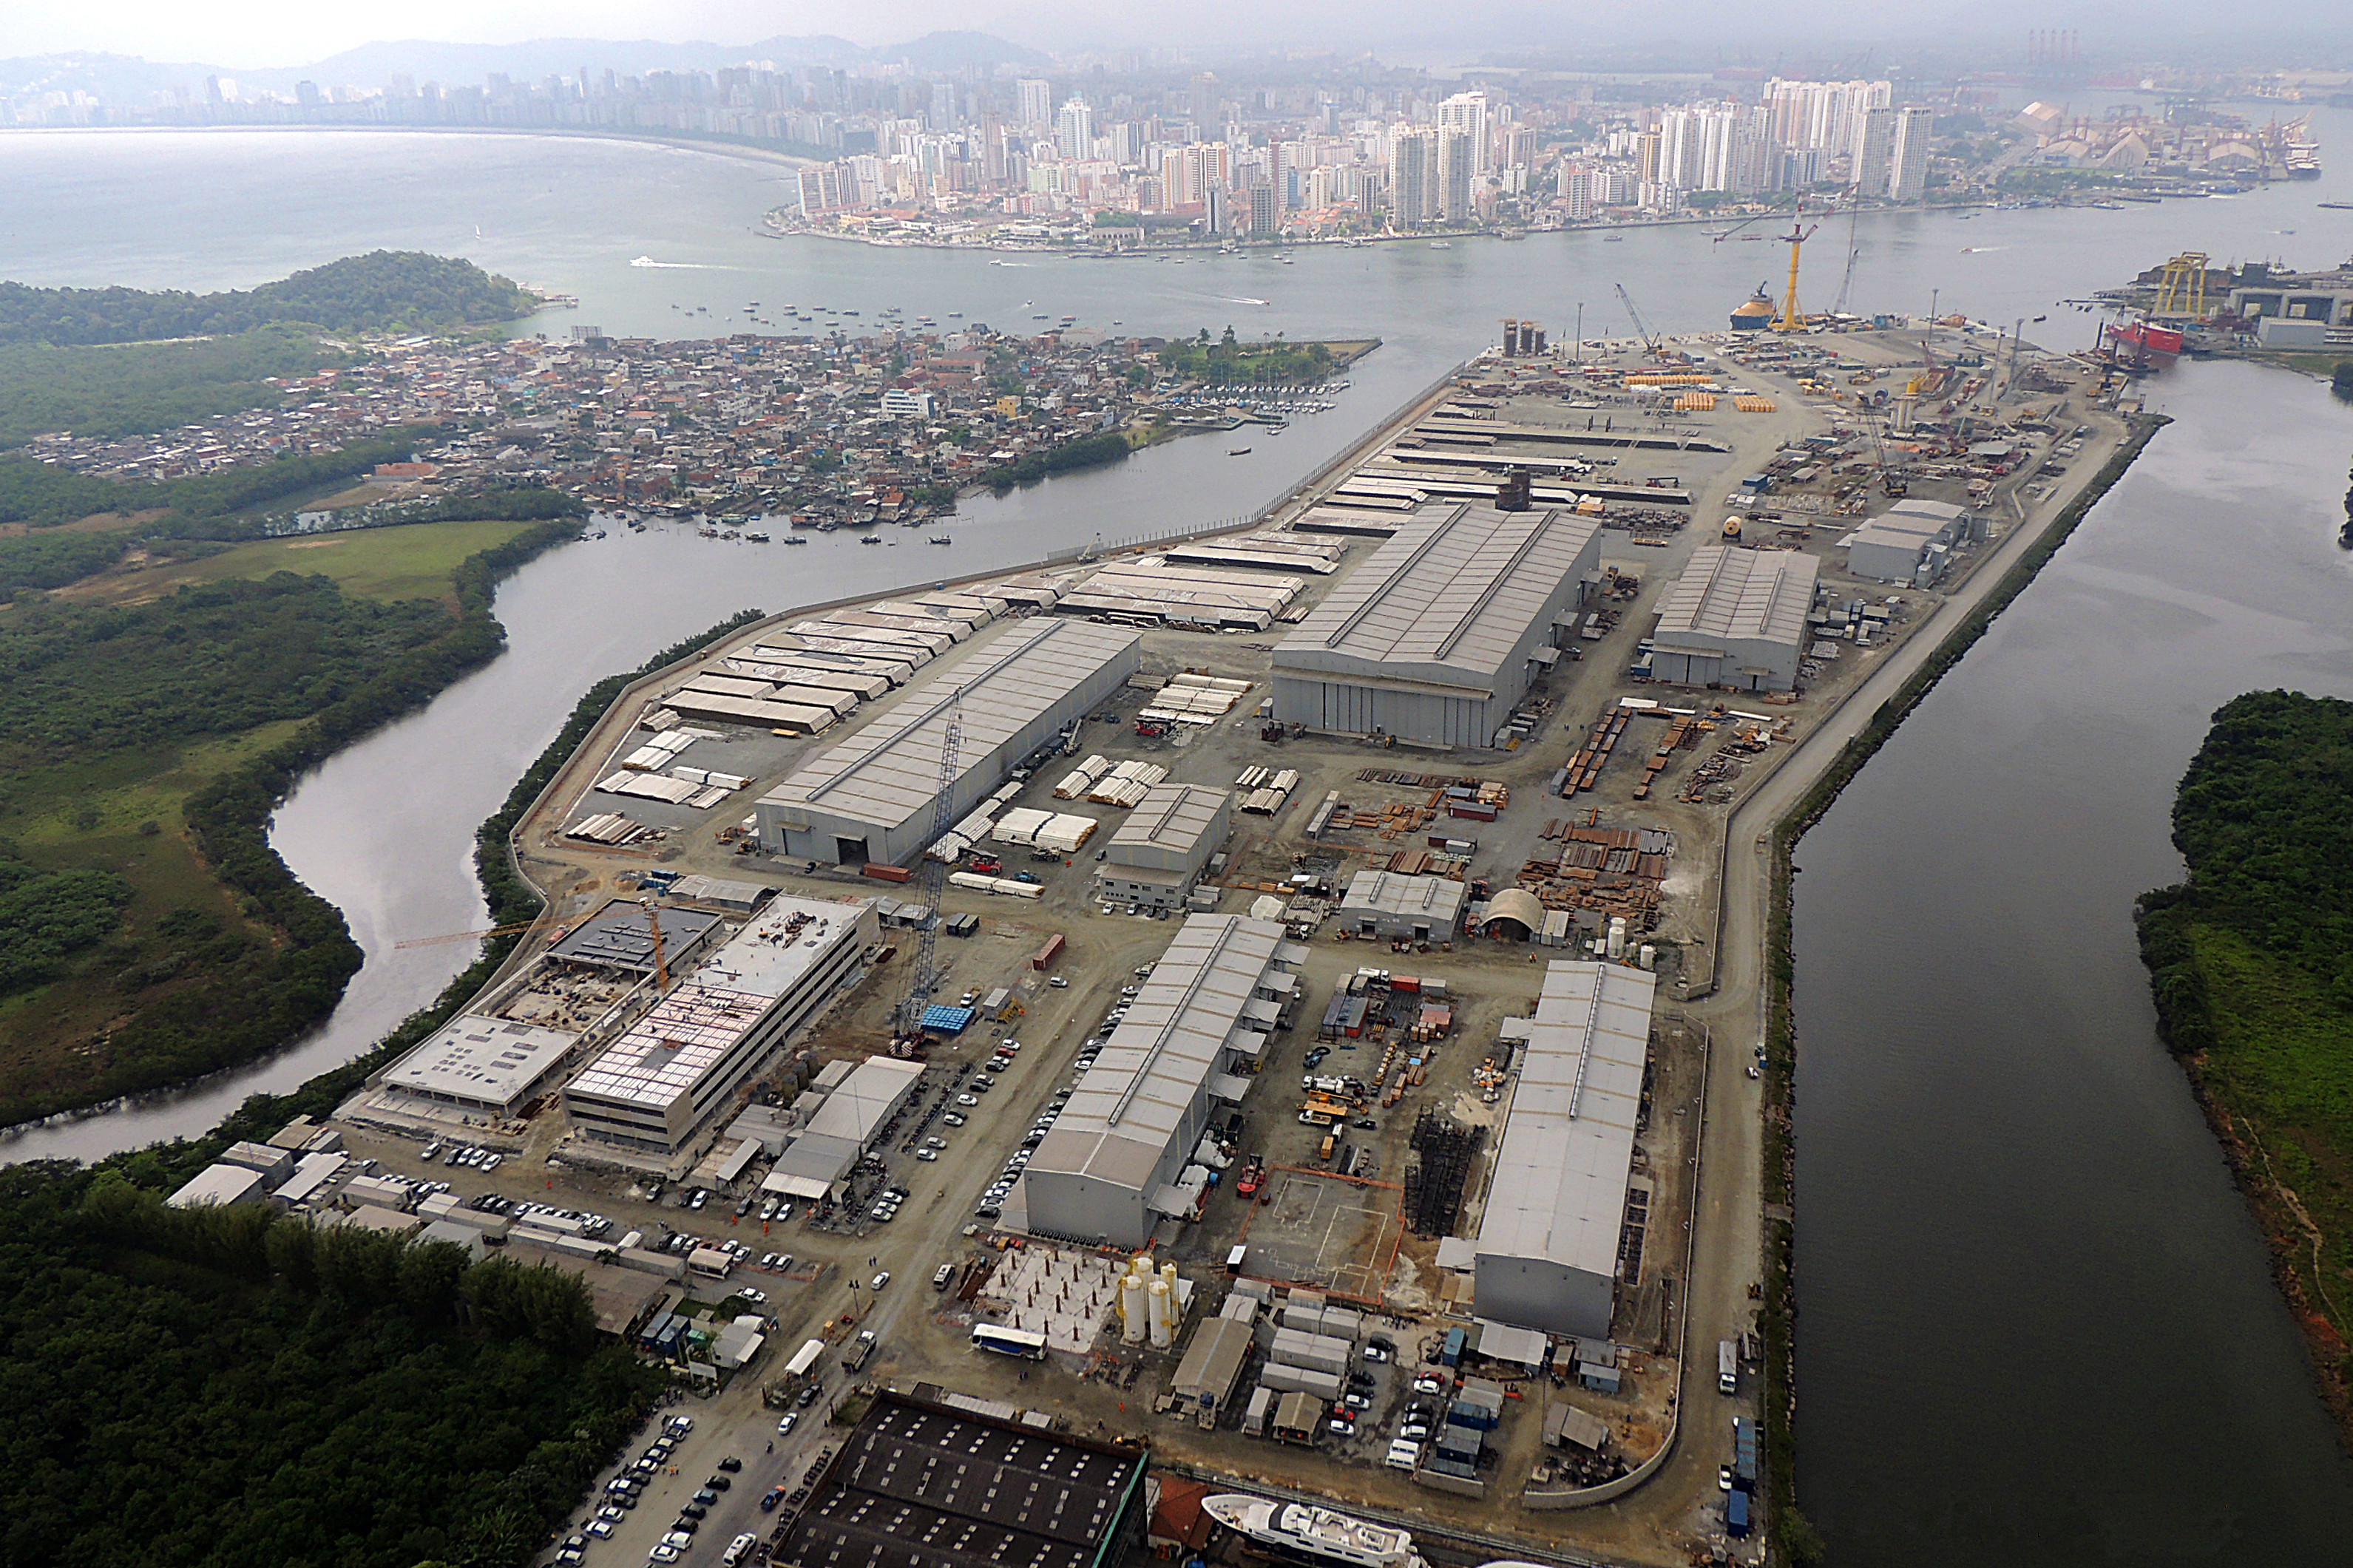
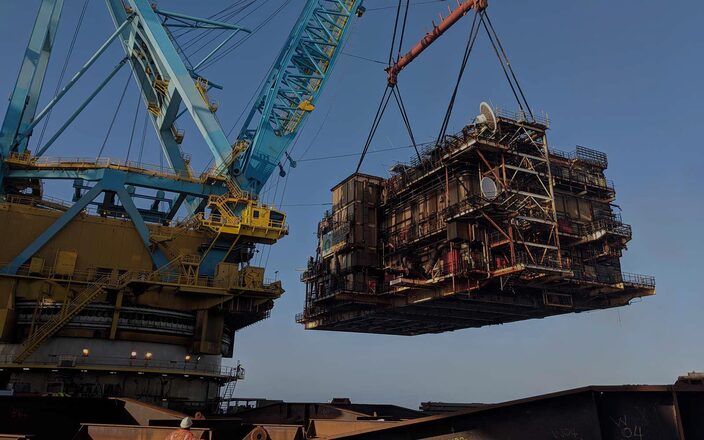
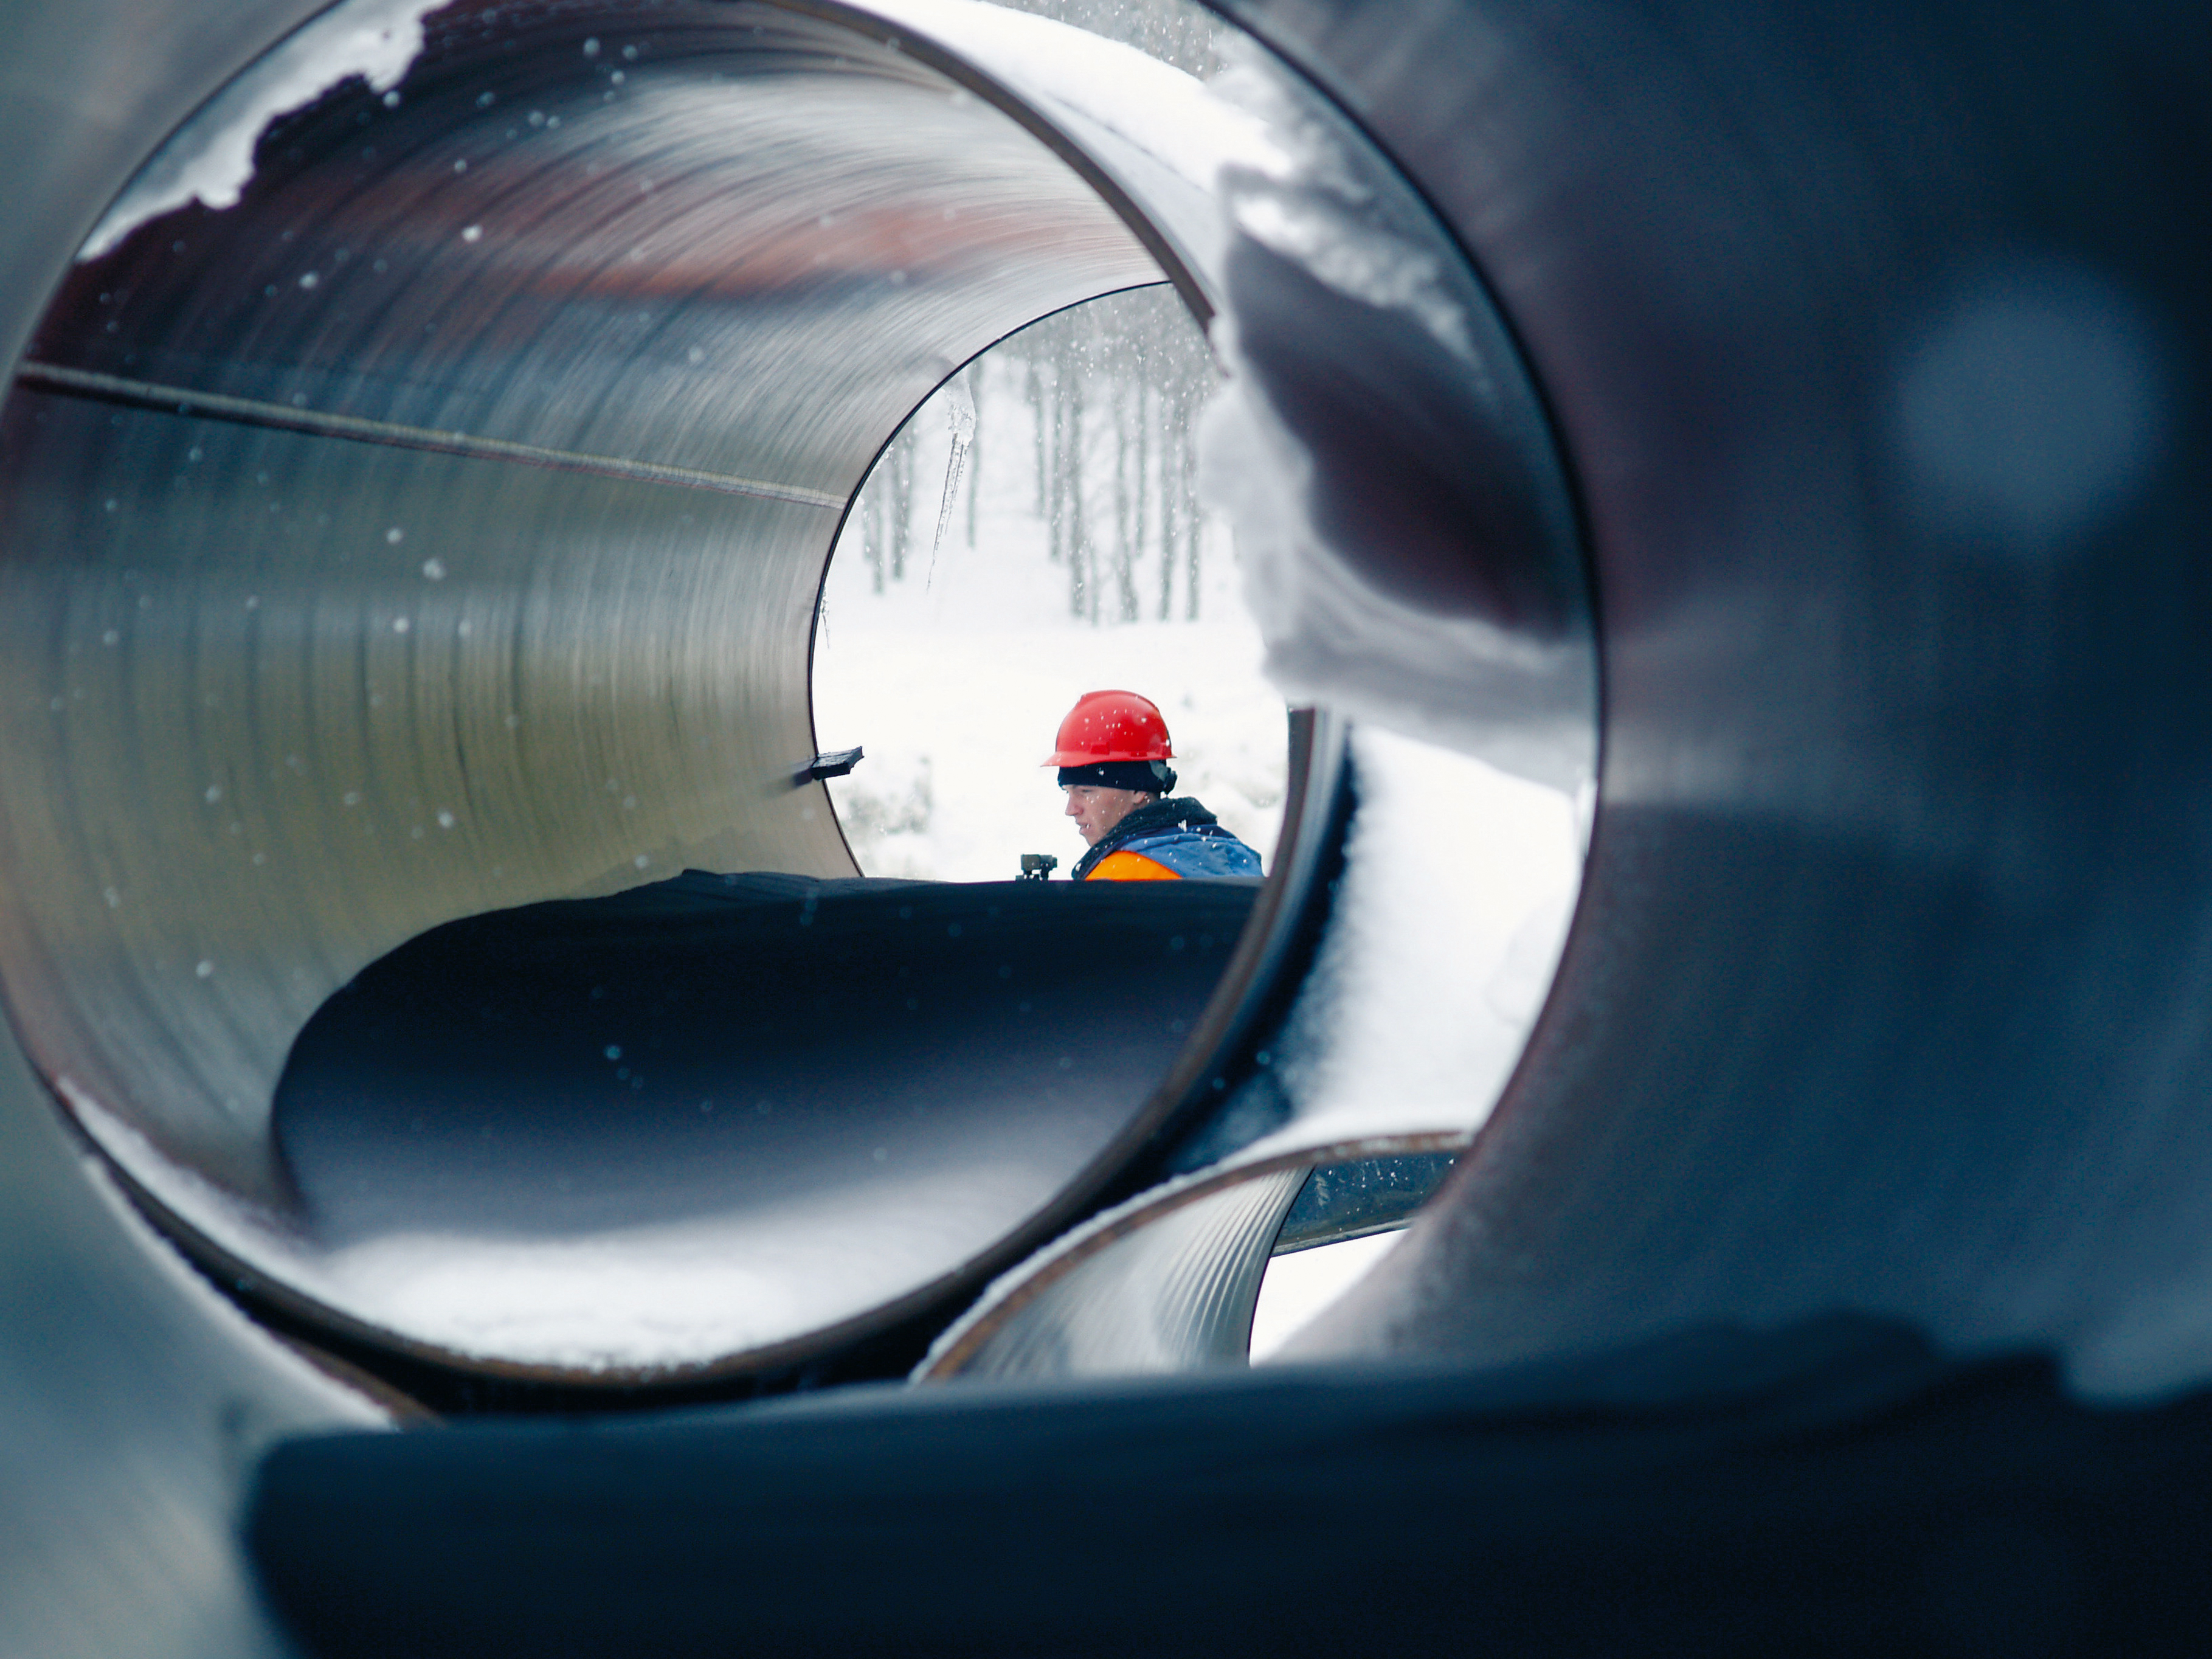
Fabrication Yard
Saipem's Fabrication Yards are located in key areas for the industry.
Image
Image

Image
Image
Image
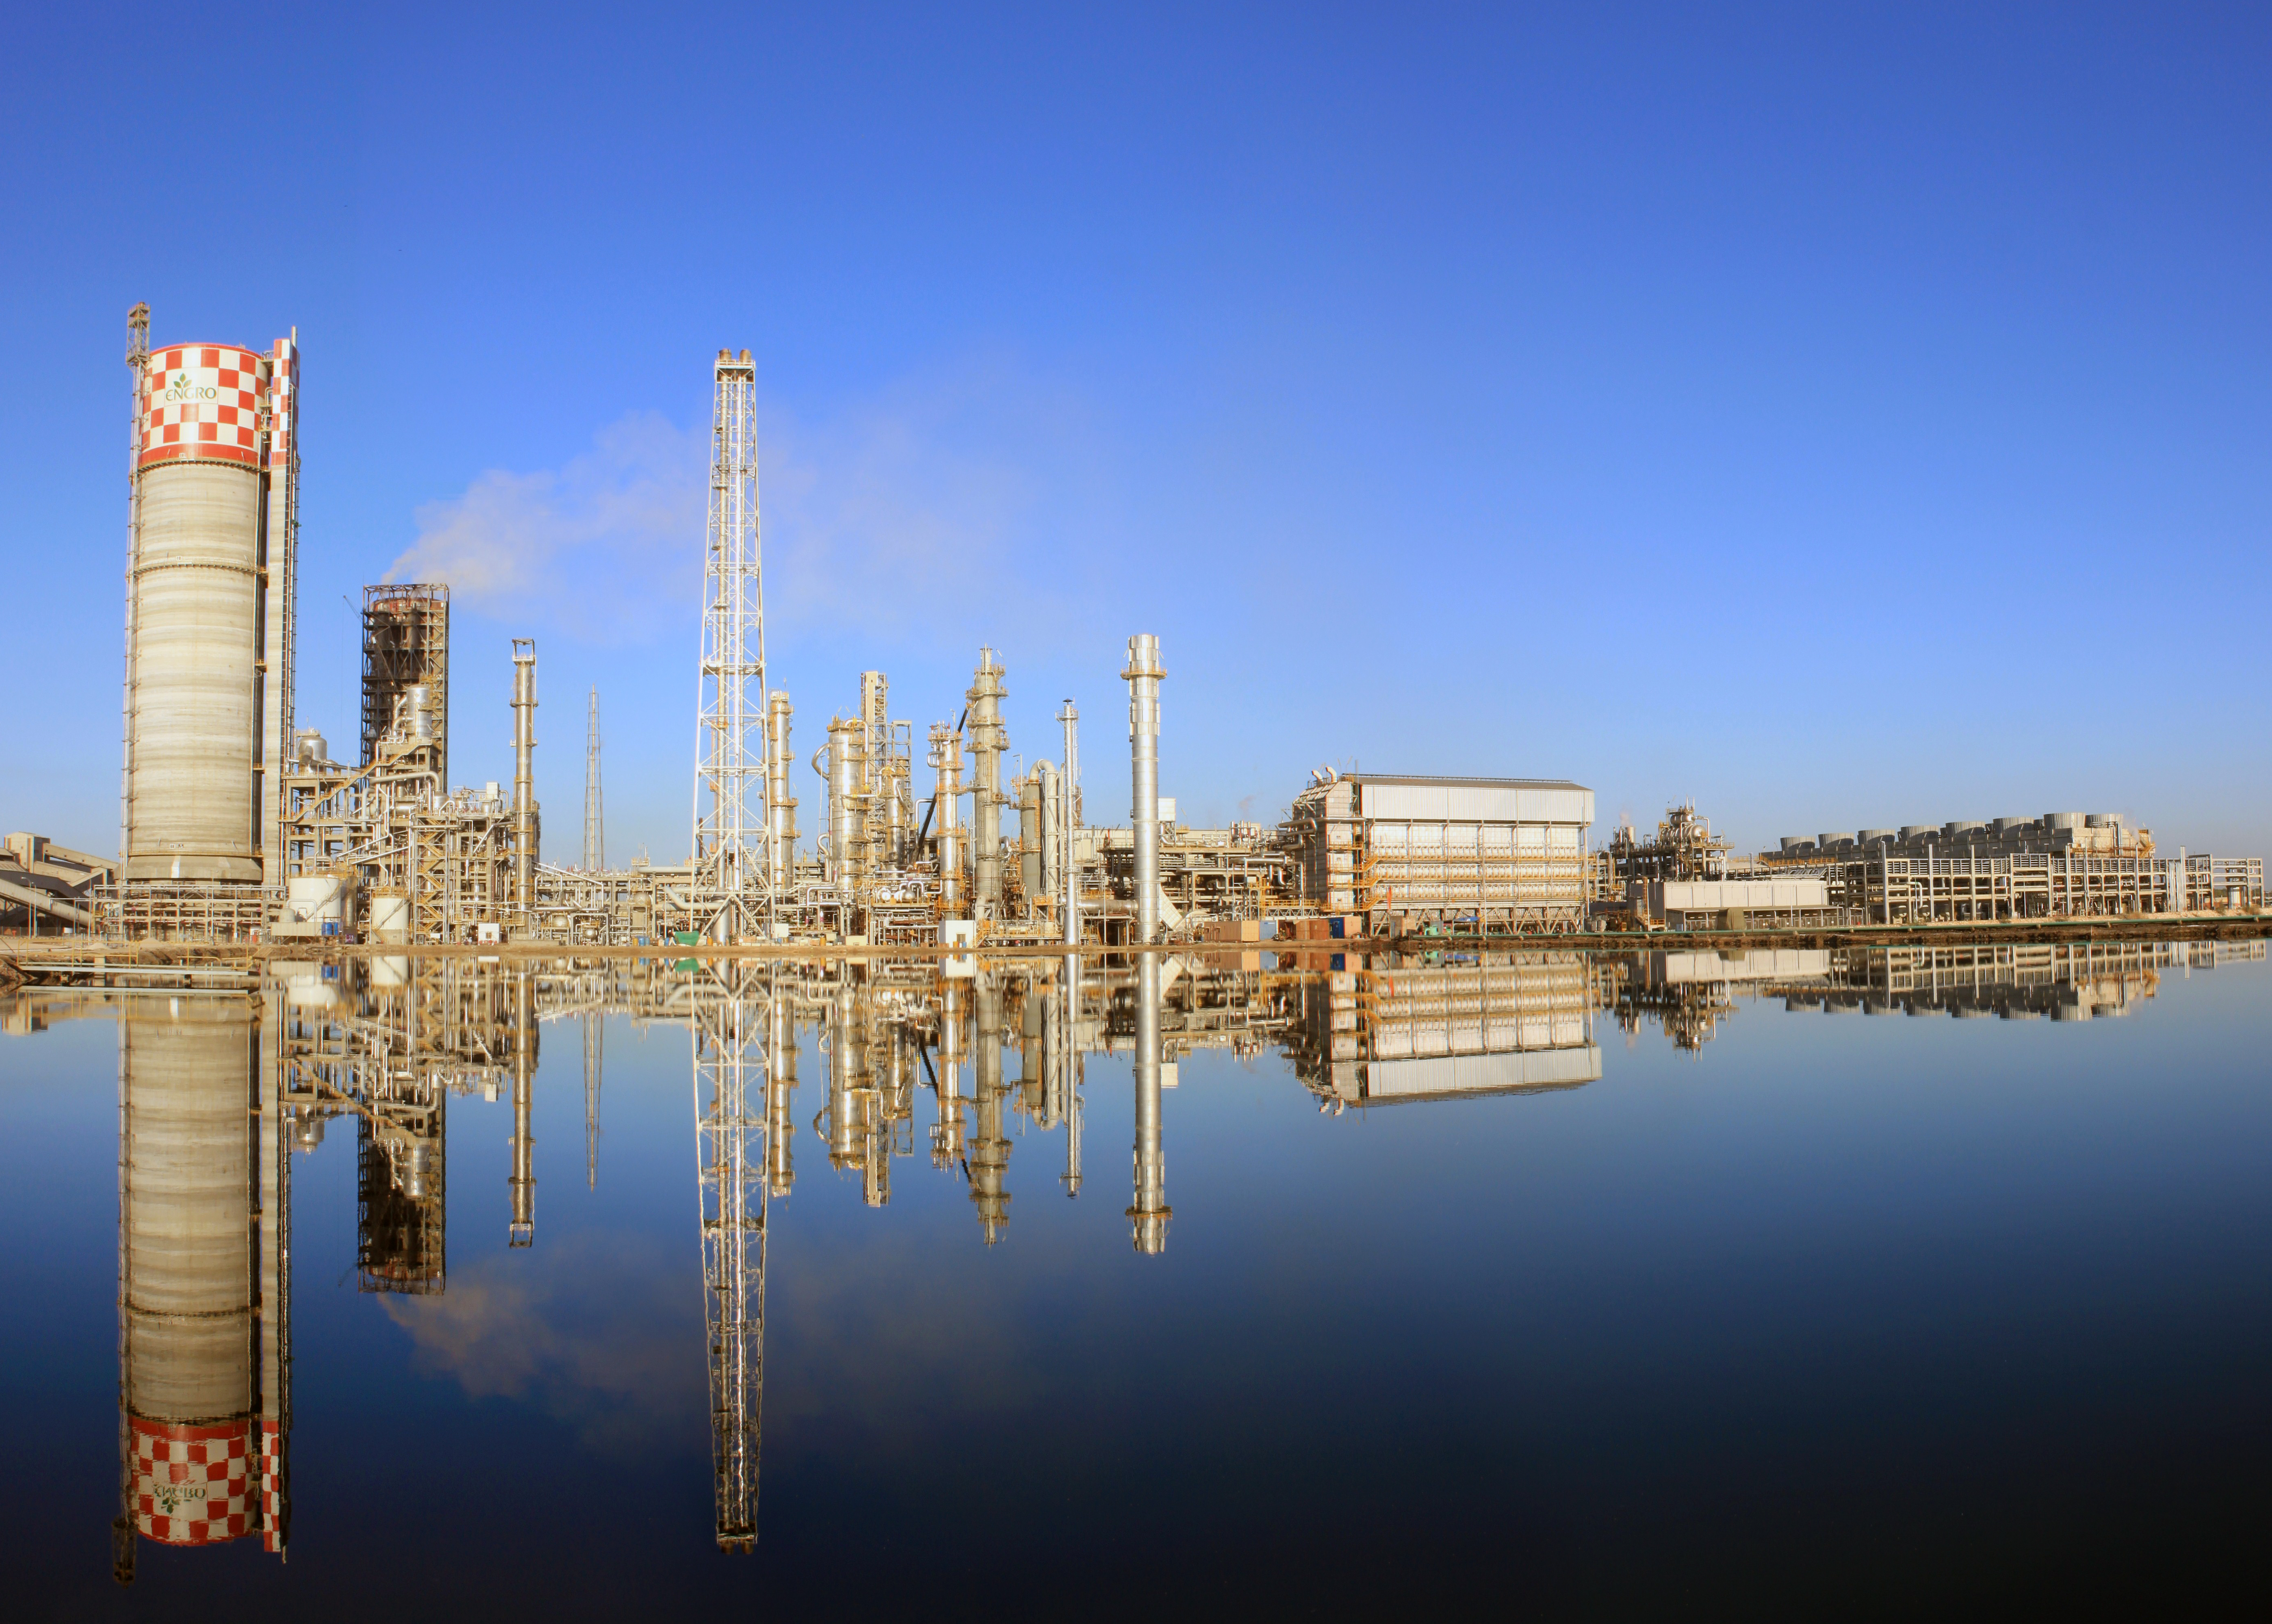
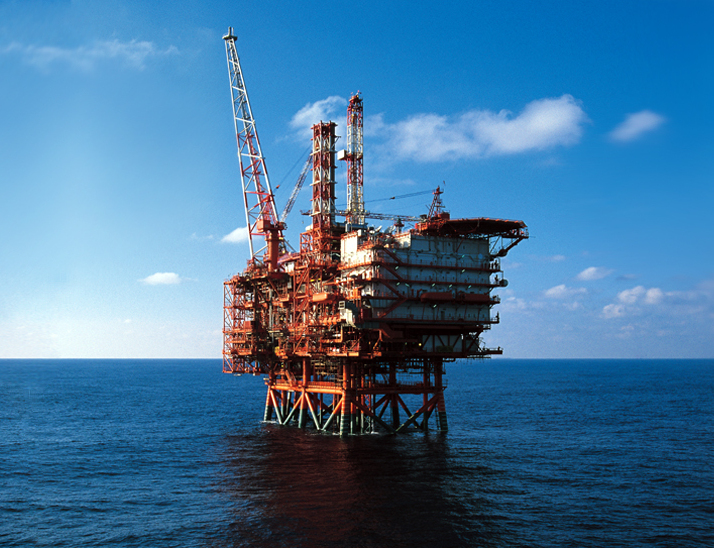
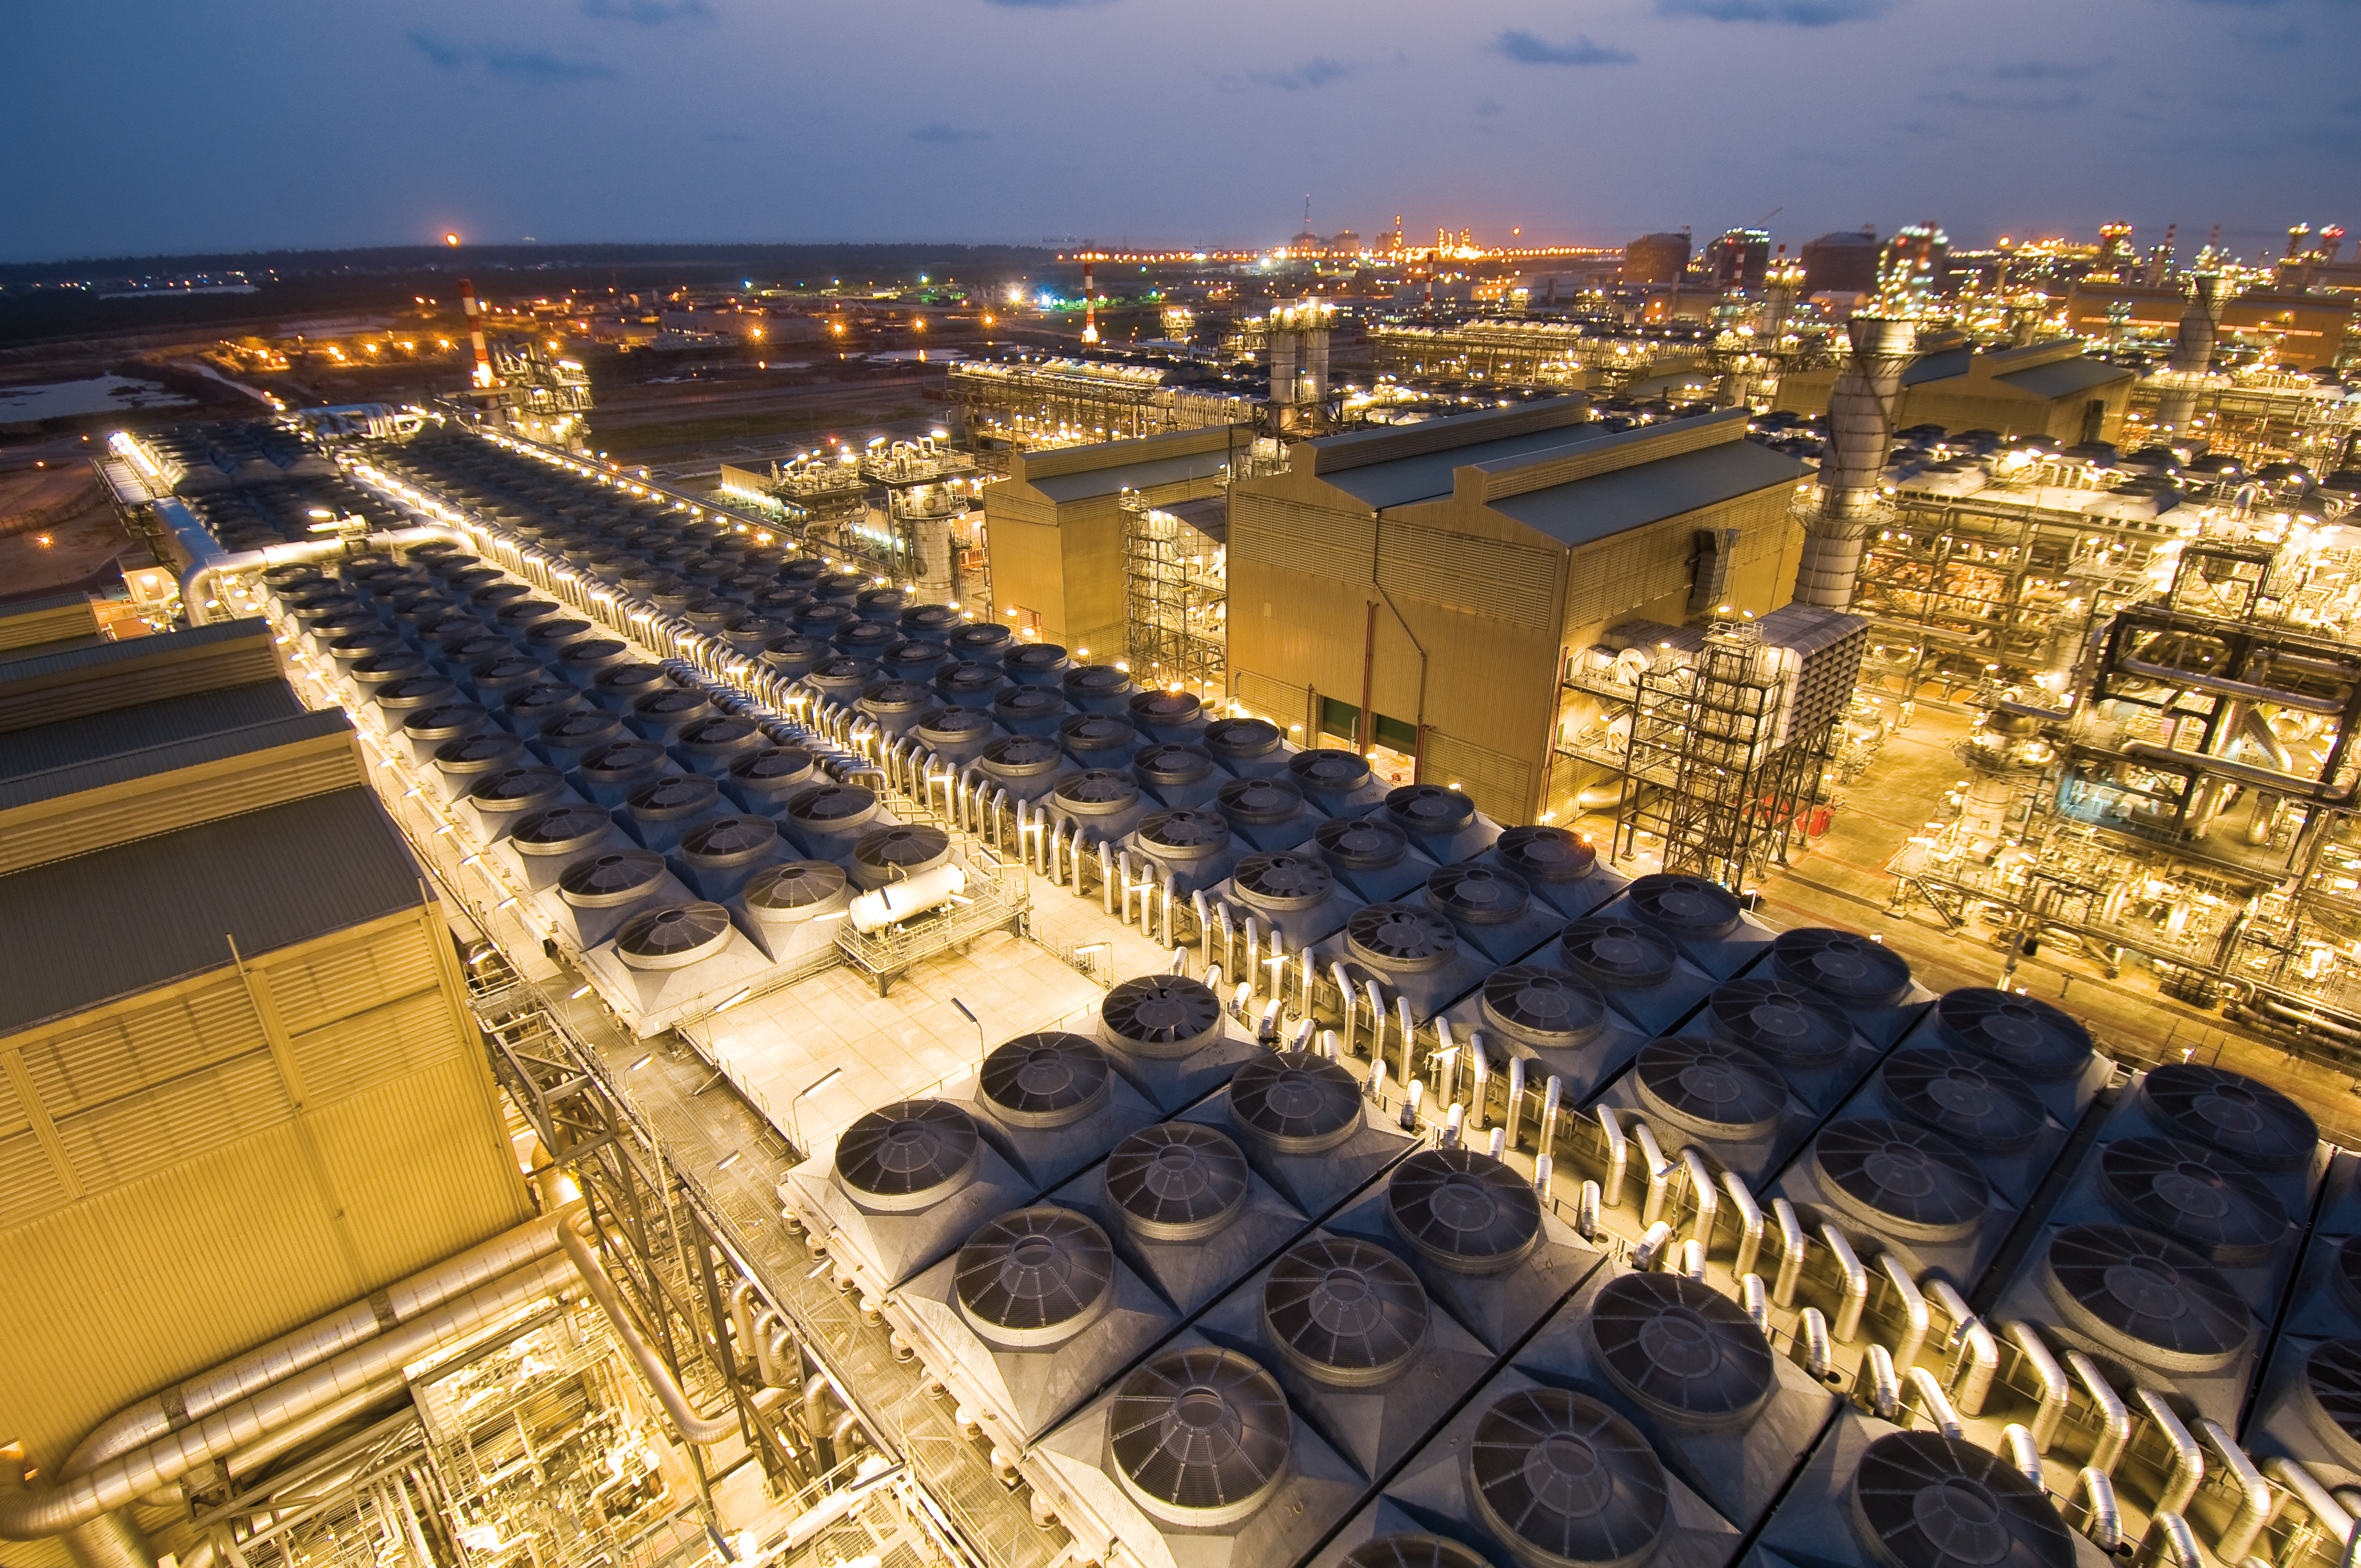
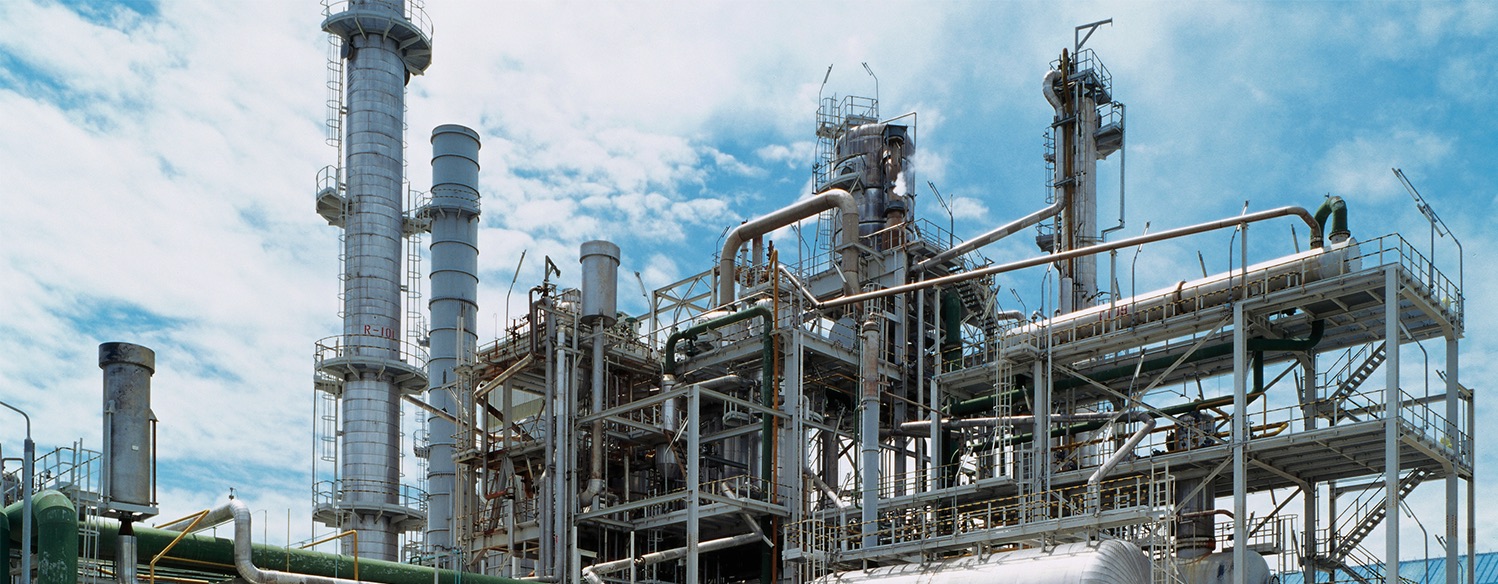
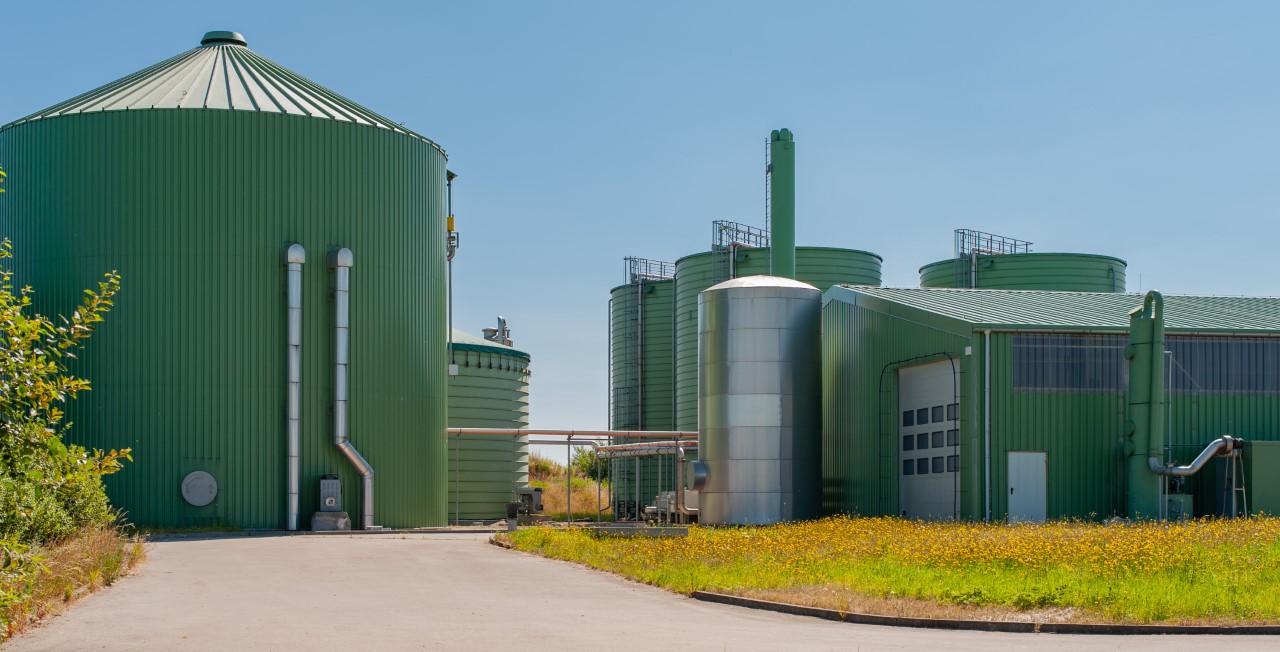
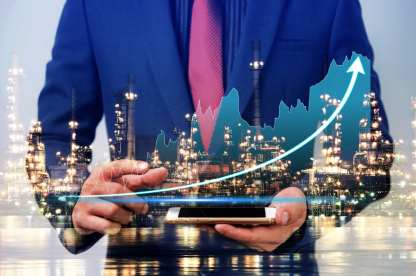
Gas monetisation
Proven experience in technologies to take full advantage of natural gas.
Image
Image
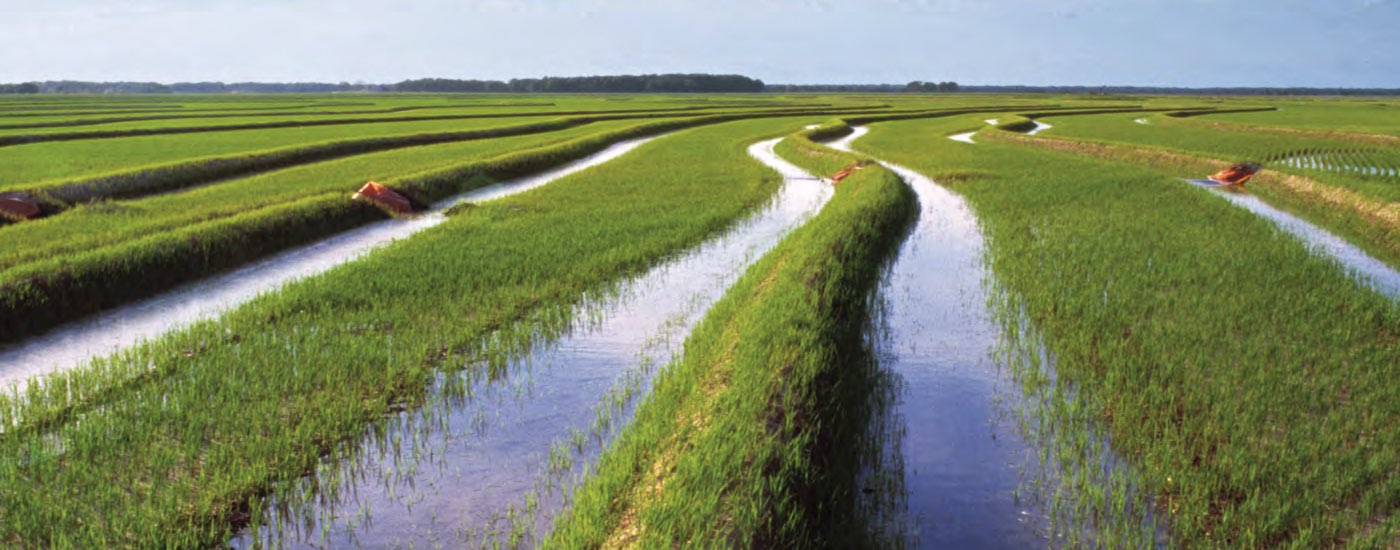
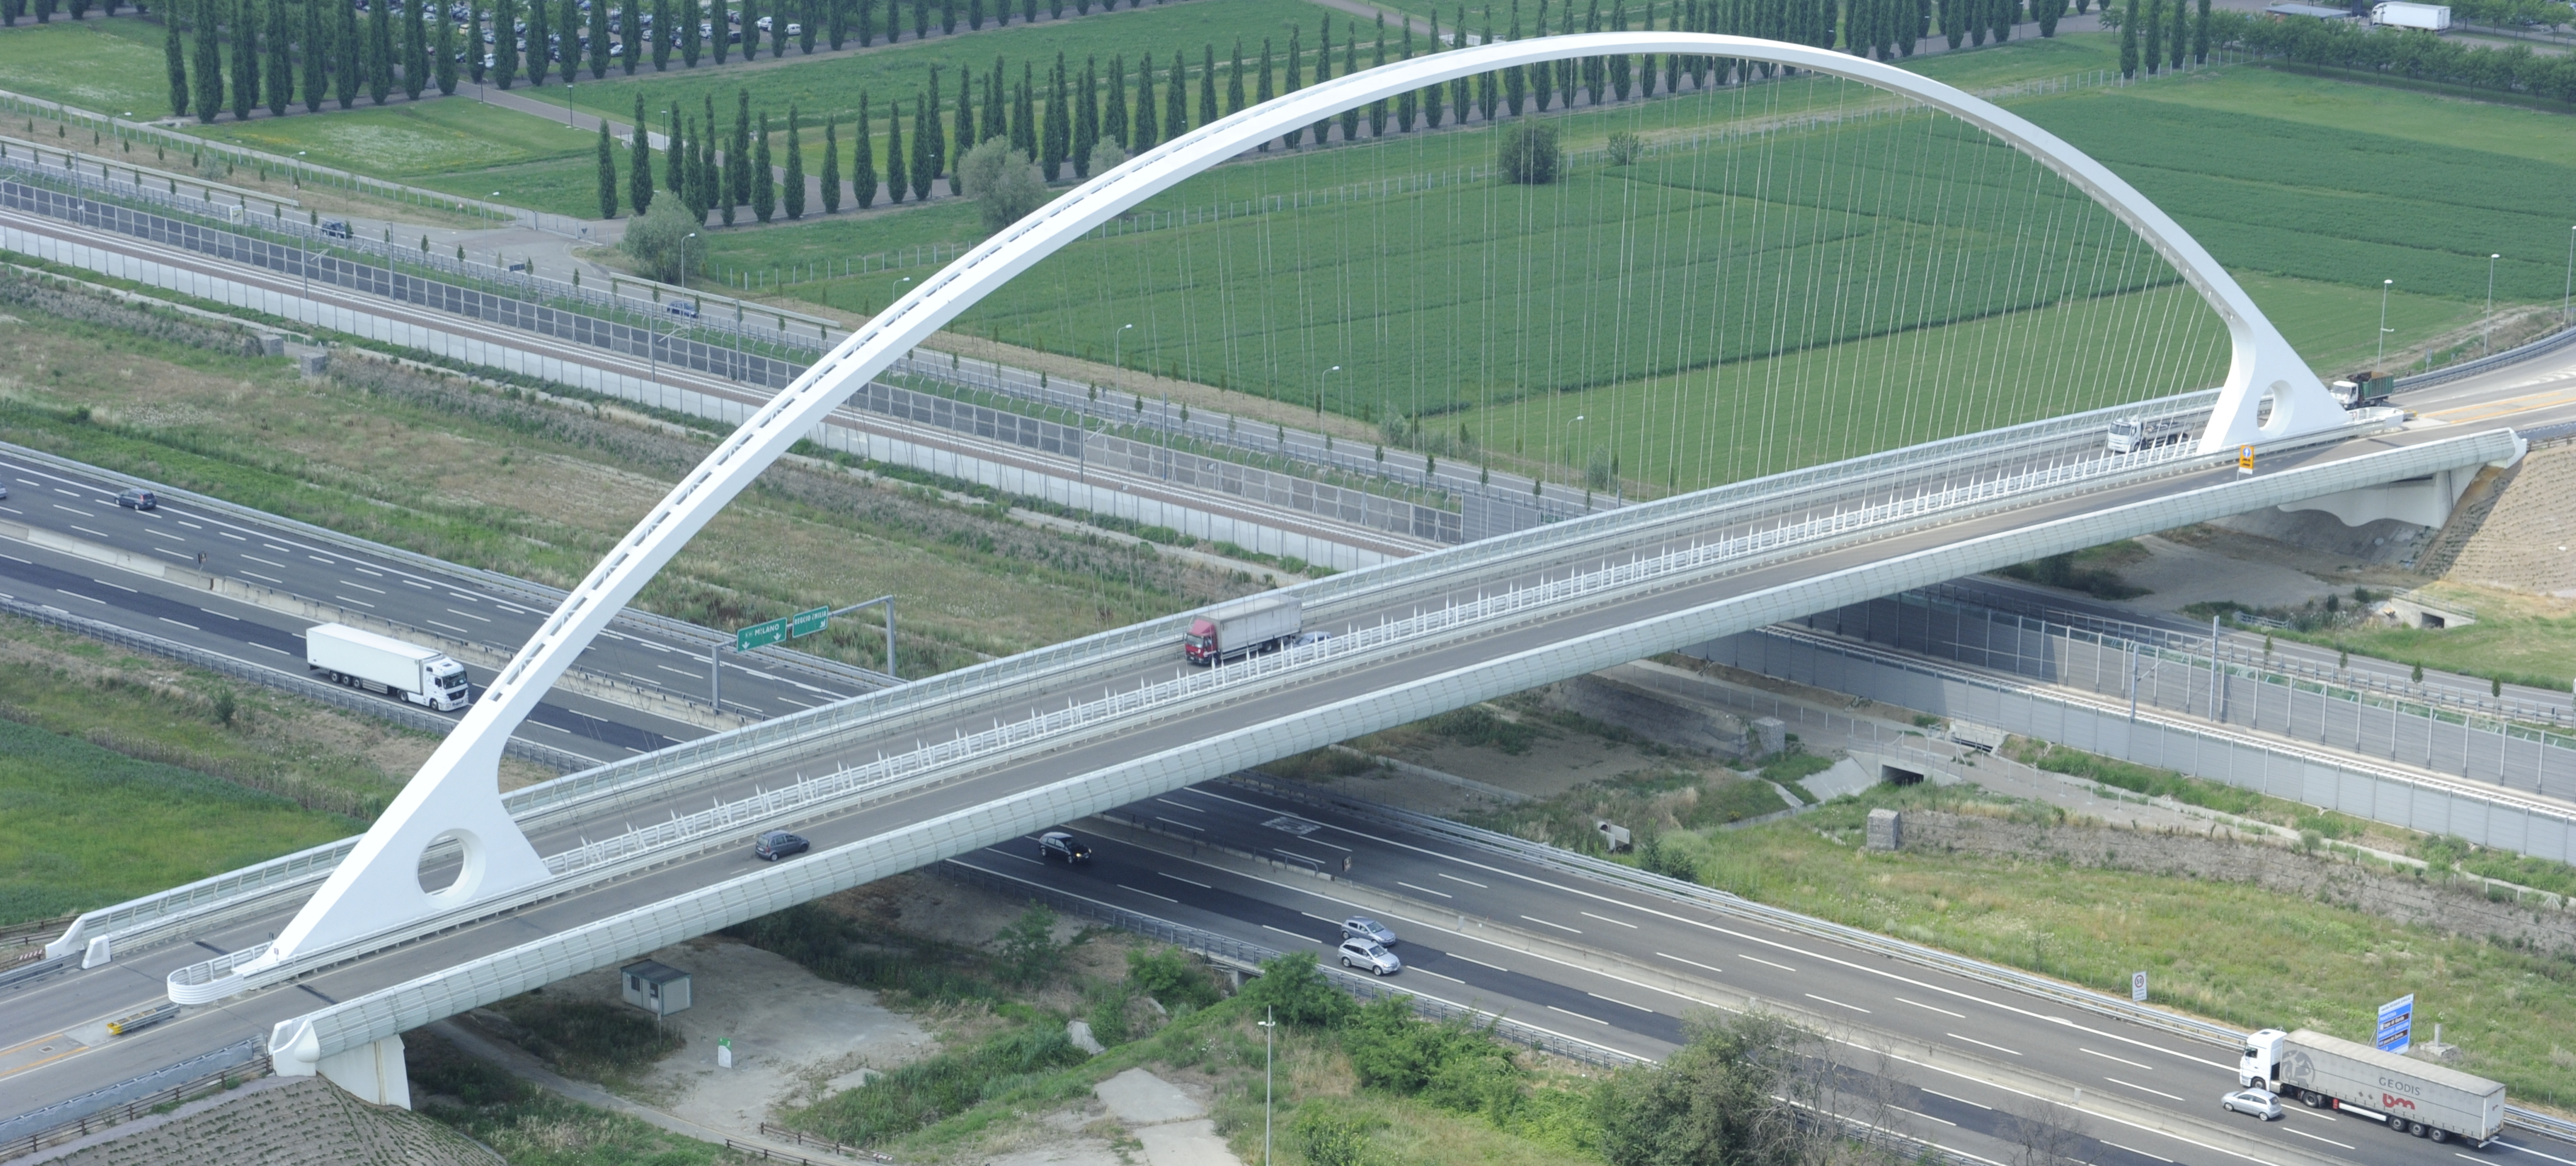
Conventional Onshore
The right partner on land to guarantee a successful project with innovative, original solution.
Image
Image
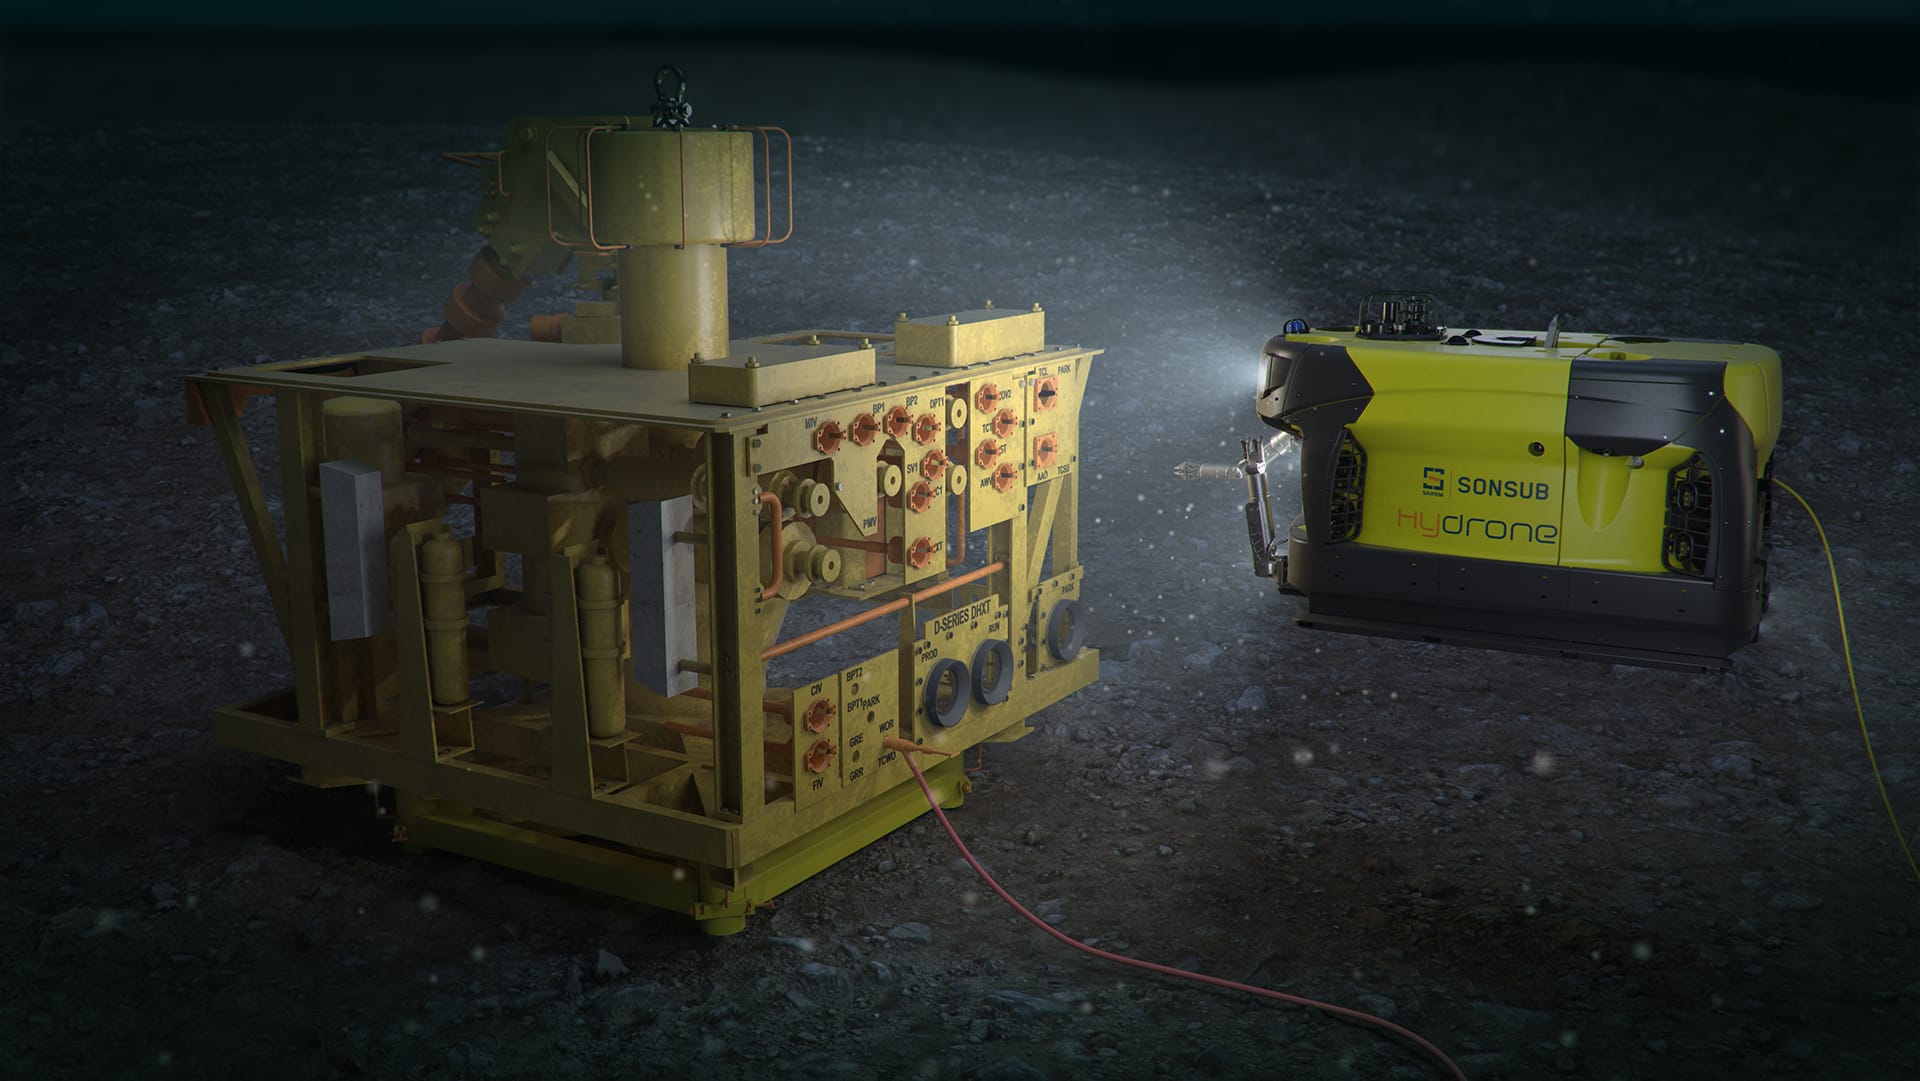
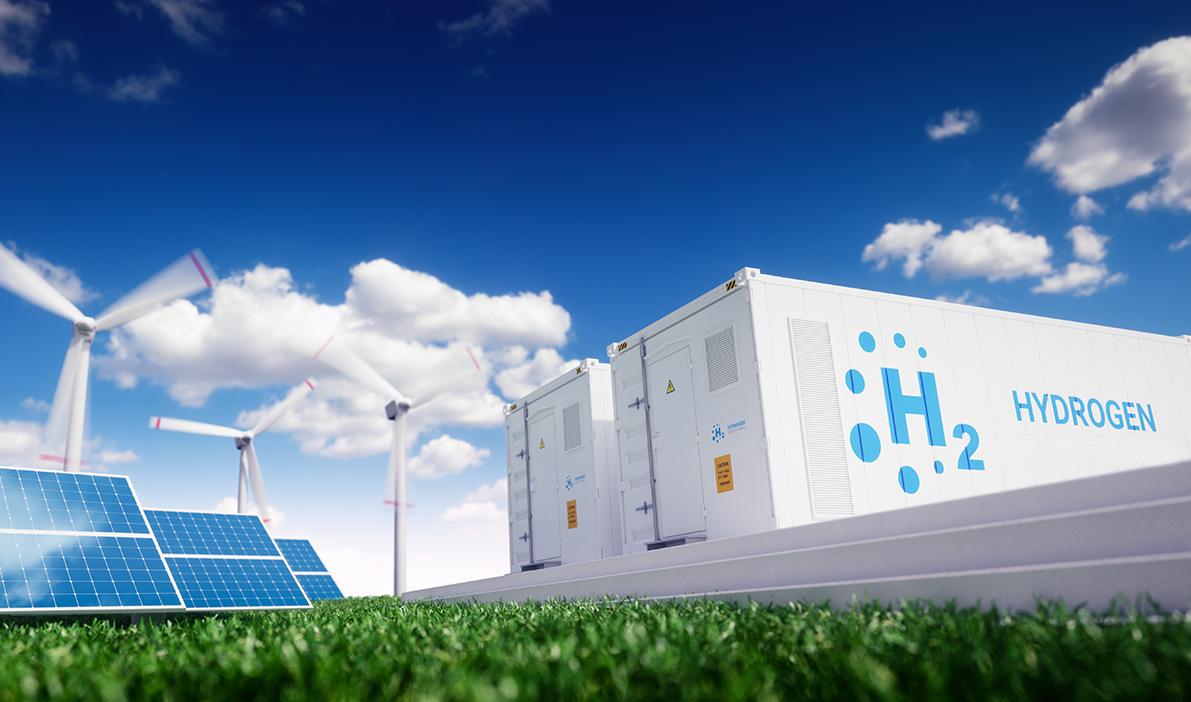
CCUS - Carbon Capture Utilization and Storage
Our benchmarks in the CO₂ management chain.
Image
Image
Image
Image
Image
Image
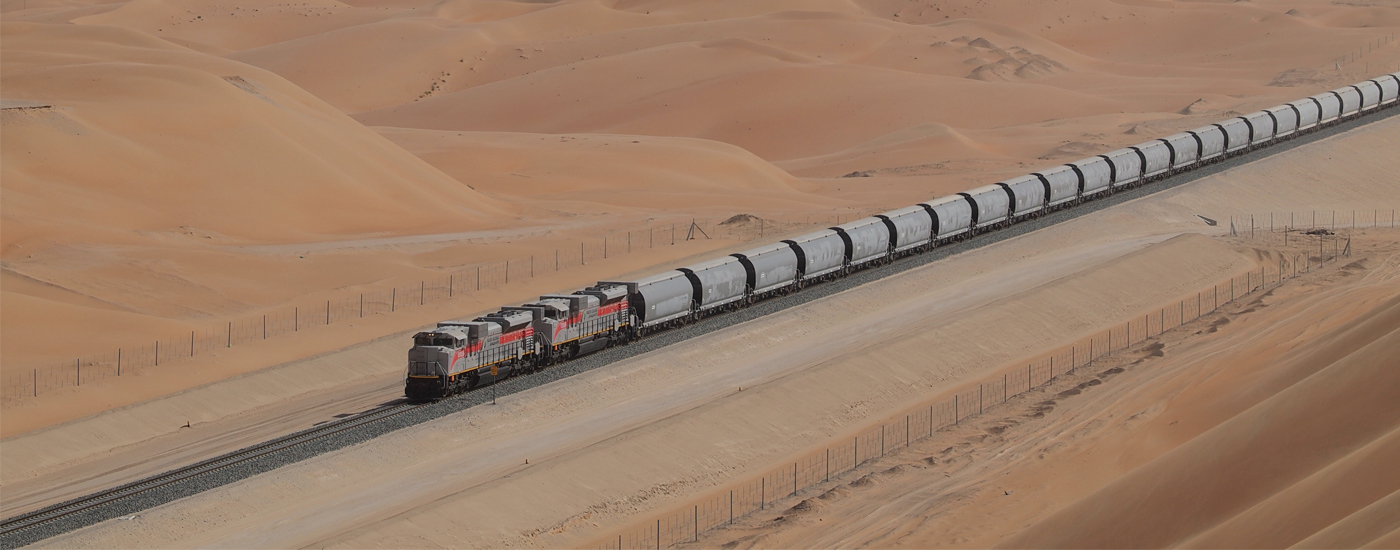
Railways serving installations
We transform needs of stakeholders into services and customizable, safe and sustainable products
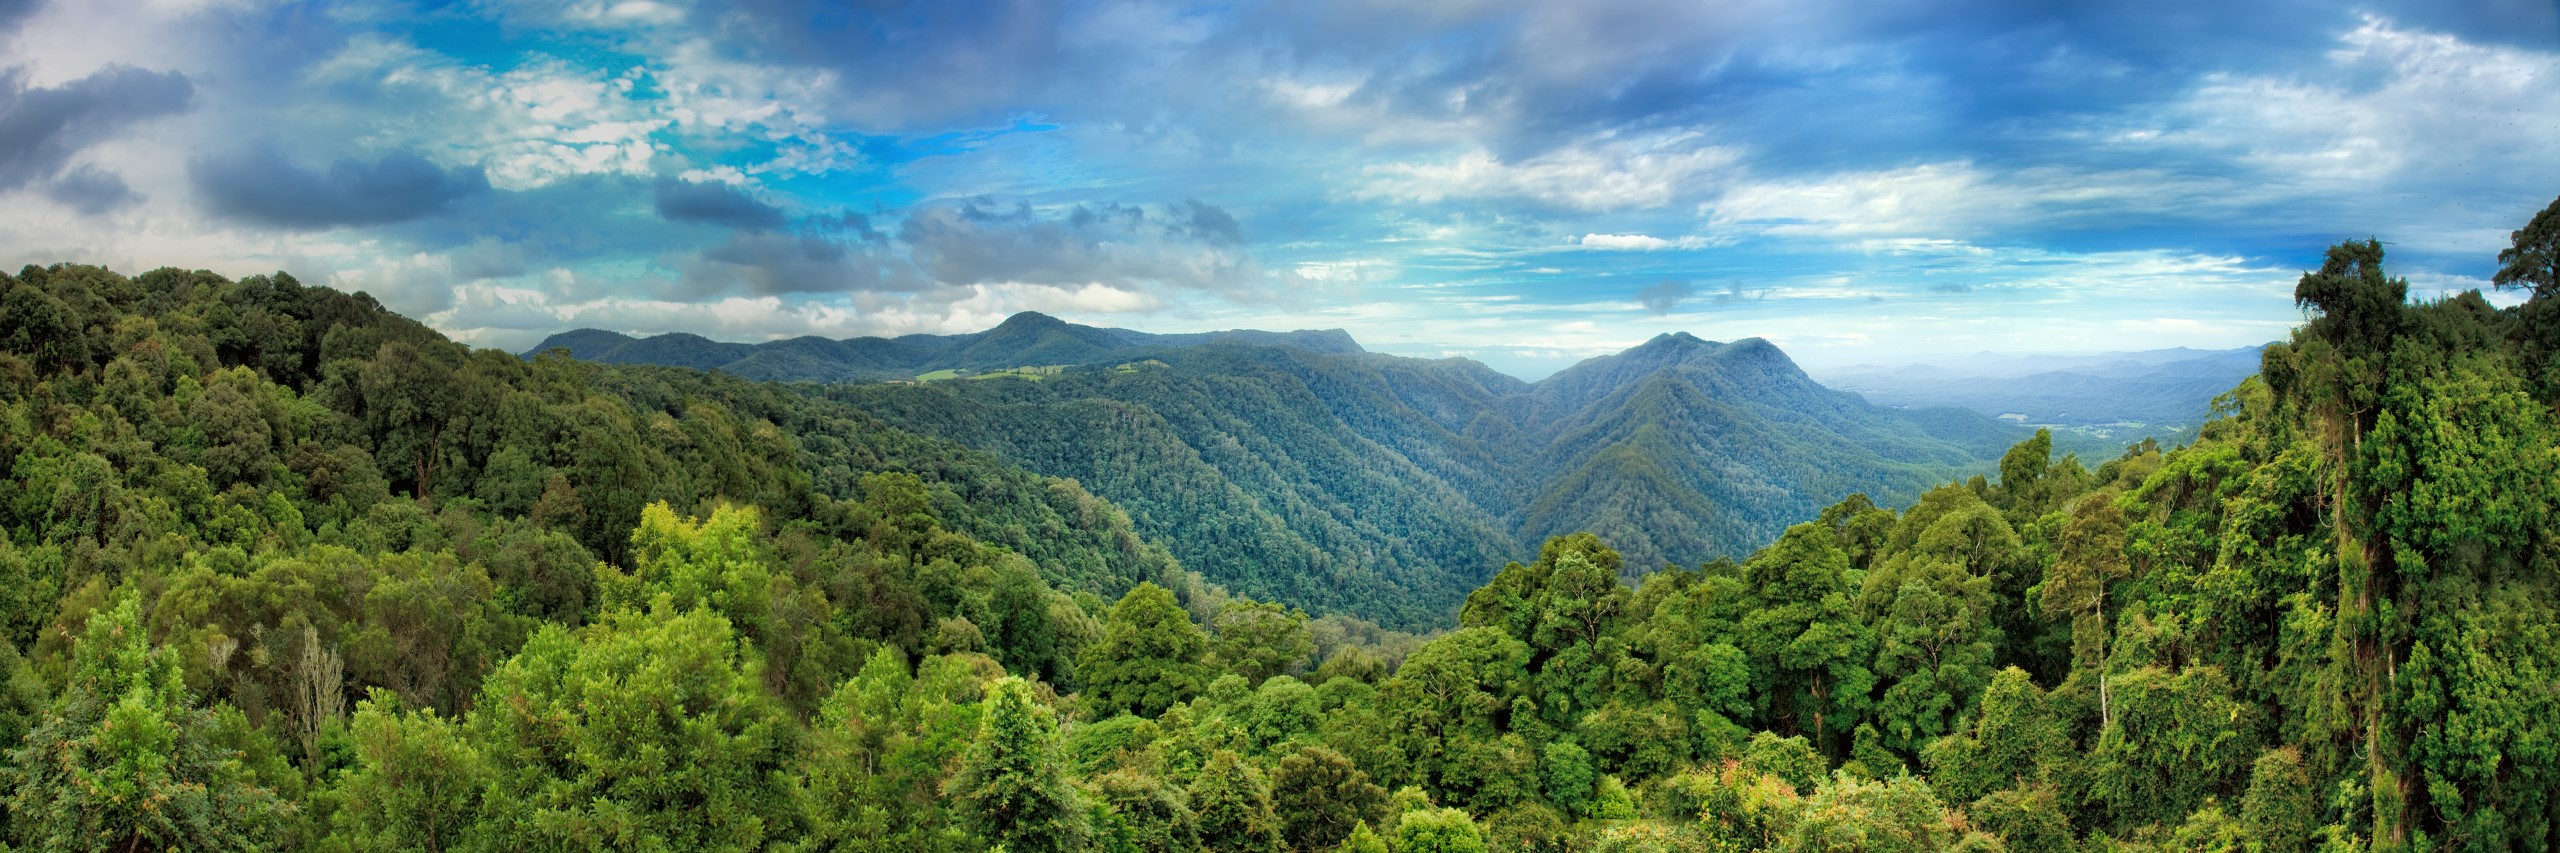
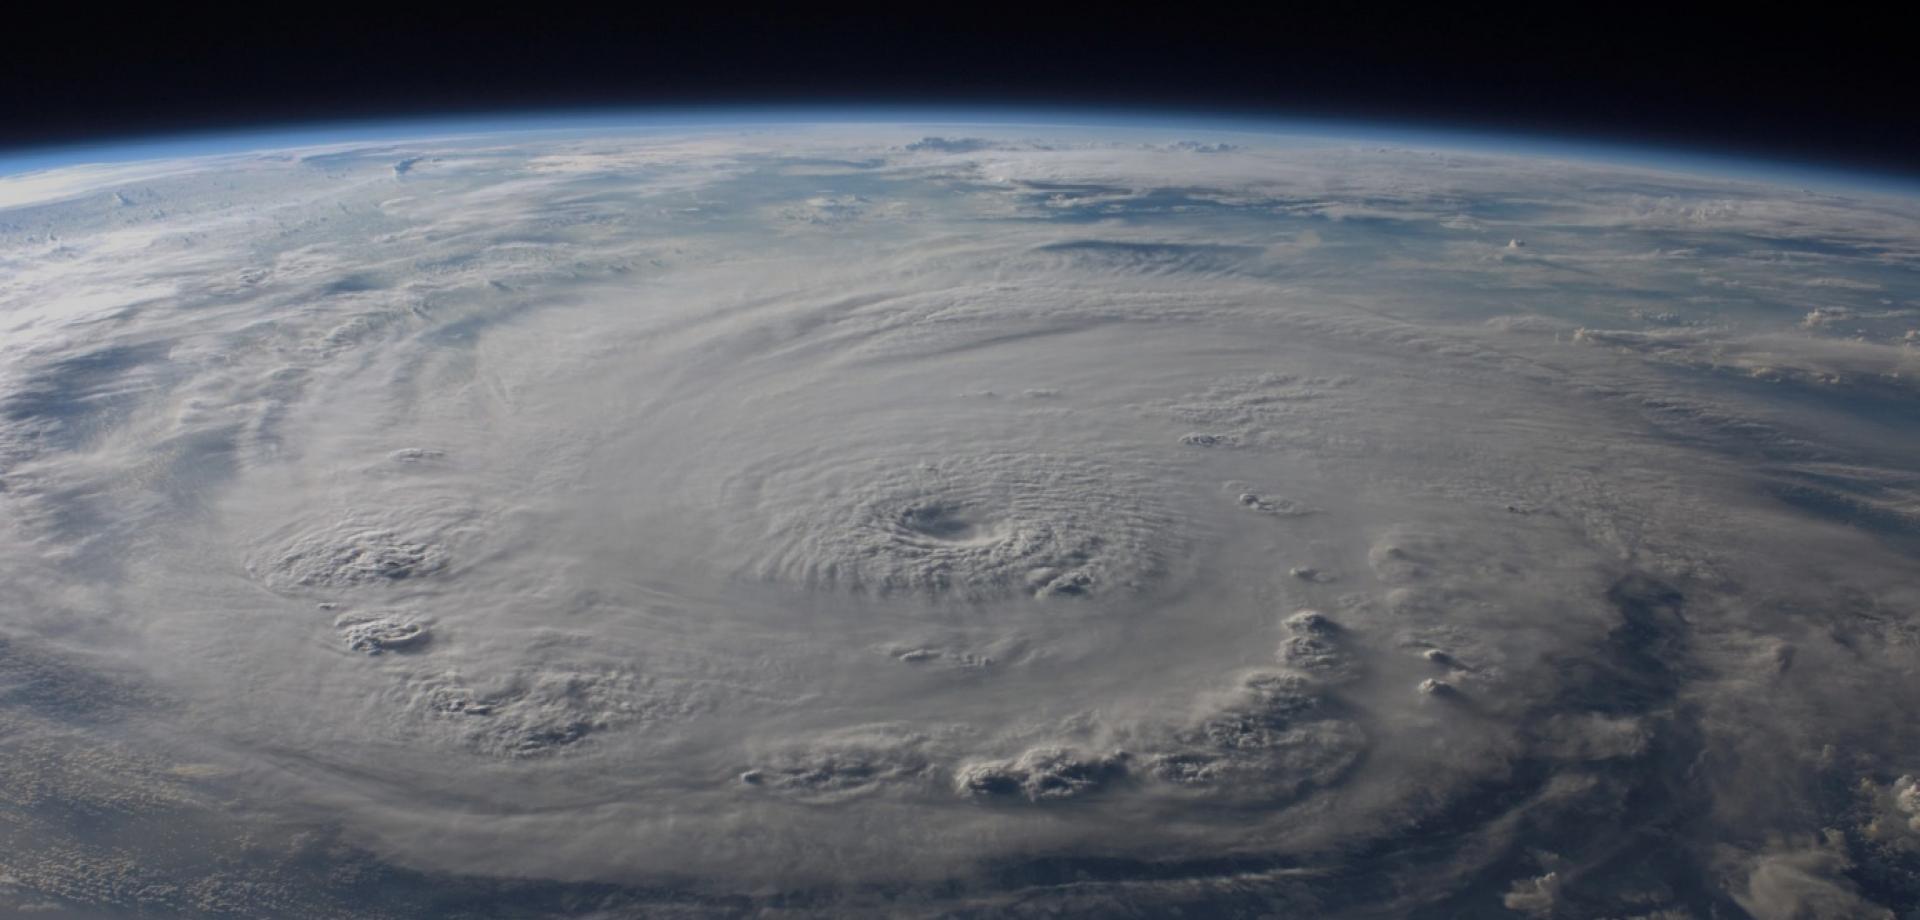
Sustainability
Sustainability
Our commitment is to generate sustainable value for all our stakeholders, integrating environmental, social and governance
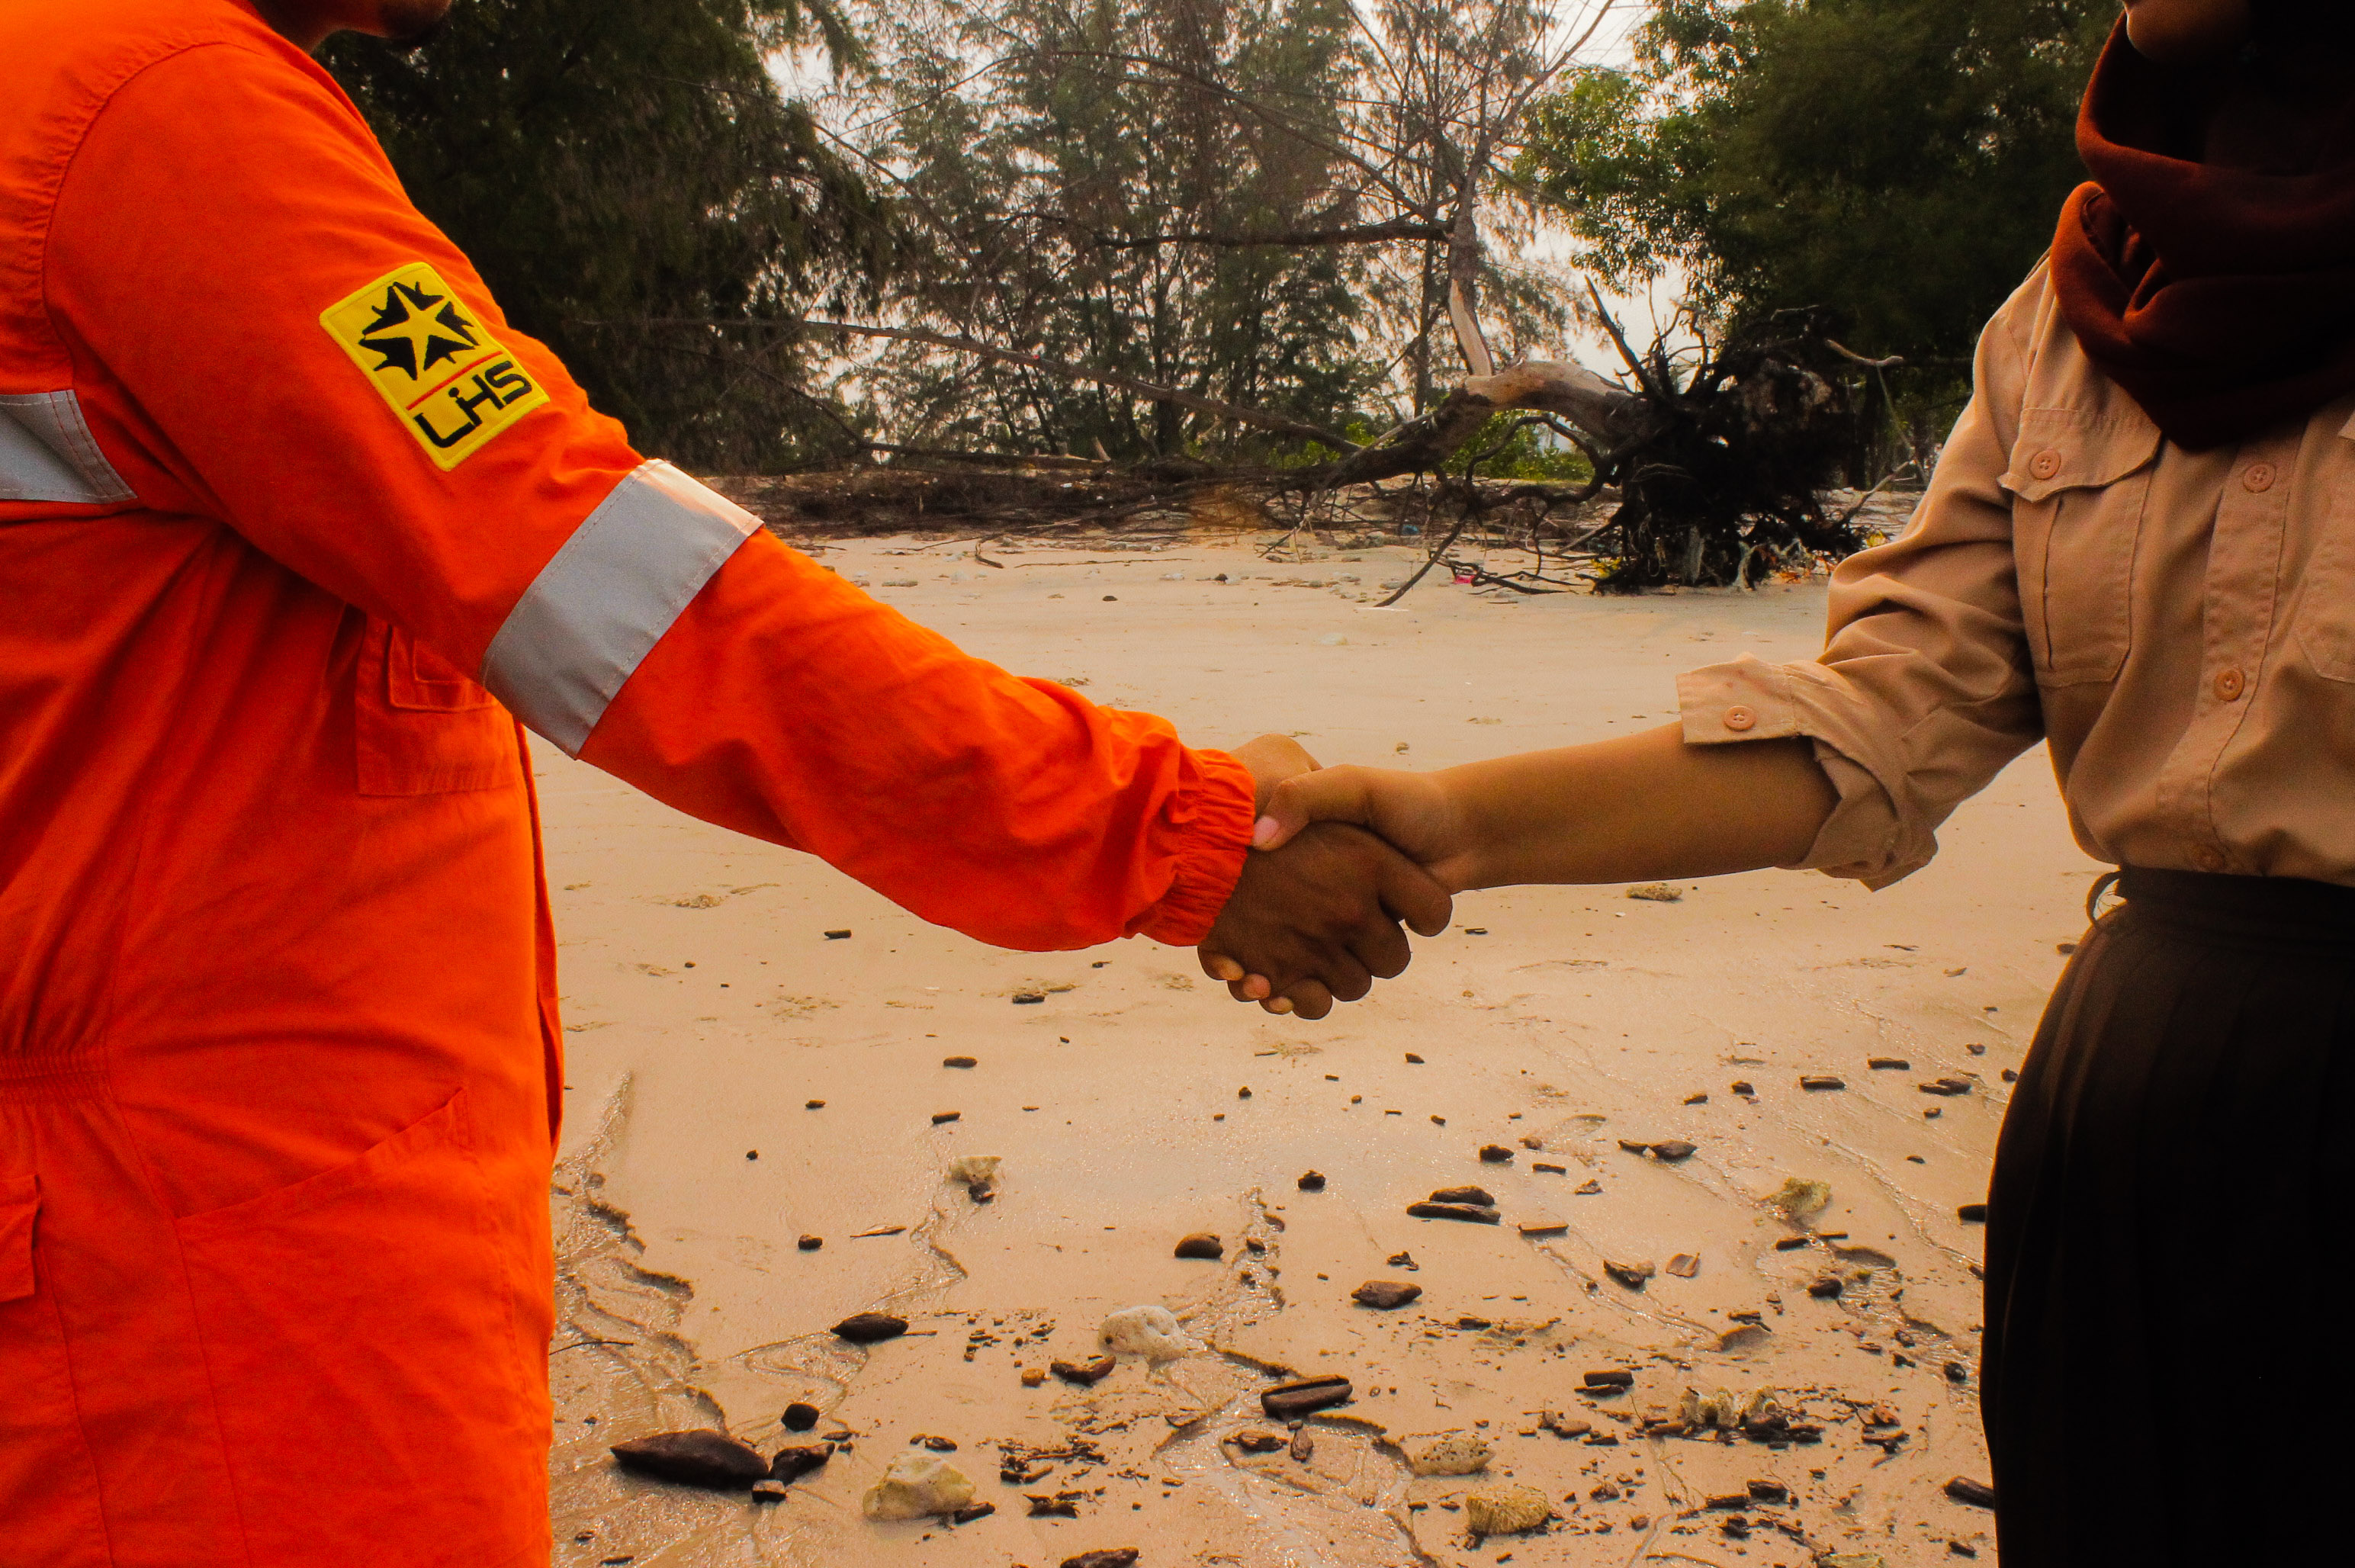
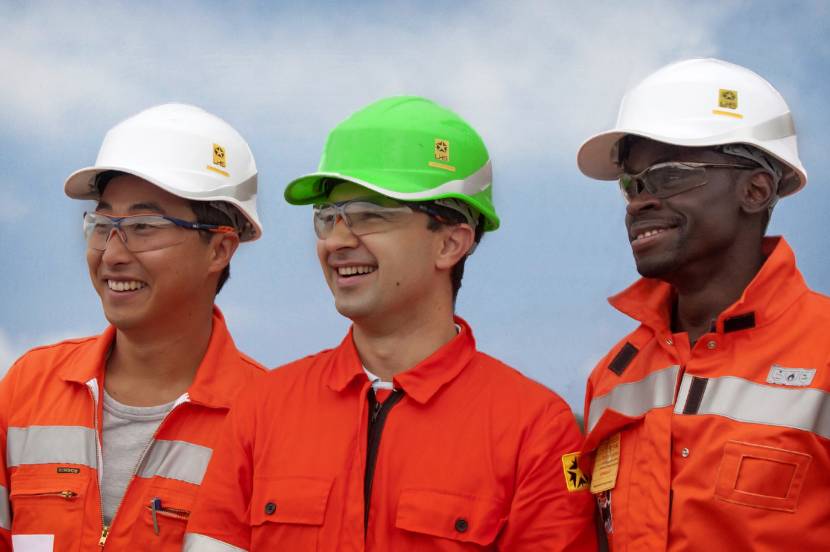
People
Diversity & Inclusion
Saipem believes in people's value, backgrounds, their leadership styles and conduct, because each individual has the potential to generate value for our company.
Image
Image
Image
Discover how Saipem has always been engineering for a sustainable future.
Through history to today. And beyond.